Immigrants from Norway vs Immigrants from Jordan 8th Grade

COMPARE

Immigrants from Norway
Race
Ancestry
AfghanAfricanAlaska NativeAlaskan AthabascanAlbanianAleutAlsatianAmericanApacheArabArapahoArgentineanArmenianAssyrian/Chaldean/SyriacAustralianAustrianBahamianBangladeshiBarbadianBasqueBelgianBelizeanBermudanBhutaneseBlackfeetBolivianBrazilianBritishBritish West IndianBulgarianBurmeseCajunCambodianCanadianCape VerdeanCarpatho RusynCelticCentral AmericanCentral American IndianCherokeeCheyenneChickasawChileanChineseChippewaChoctawColombianColvilleComancheCosta RicanCreeCreekCroatianCrowCubanCypriotCzechCzechoslovakianDanishDelawareDominicanDutchDutch West IndianEastern EuropeanEcuadorianEgyptianEnglishEstonianEthiopianEuropeanFijianFilipinoFinnishFrenchFrench American IndianFrench CanadianGermanGerman RussianGhanaianGreekGuamanian/ChamorroGuatemalanGuyaneseHaitianHmongHonduranHopiHoumaHungarianIcelanderIndian (Asian)IndonesianInupiatIranianIraqiIrishIroquoisIsraeliItalianJamaicanJapaneseJordanianKenyanKiowaKoreanLaotianLatvianLebaneseLiberianLithuanianLumbeeLuxembourgerMacedonianMalaysianMalteseMarshalleseMenomineeMexicanMexican American IndianMongolianMoroccanNative HawaiianNavajoNepaleseNew ZealanderNicaraguanNigerianNorthern EuropeanNorwegianOkinawanOsageOttawaPaiutePakistaniPalestinianPanamanianParaguayanPennsylvania GermanPeruvianPimaPolishPortuguesePotawatomiPuebloPuerto RicanPuget Sound SalishRomanianRussianSalvadoranSamoanScandinavianScotch-IrishScottishSeminoleSenegaleseSerbianShoshoneSierra LeoneanSiouxSlavicSlovakSloveneSomaliSouth AfricanSouth AmericanSouth American IndianSoviet UnionSpaniardSpanishSpanish AmericanSpanish American IndianSri LankanSubsaharan AfricanSudaneseSwedishSwissSyrianTaiwaneseThaiTlingit-HaidaTohono O'OdhamTonganTrinidadian and TobagonianTsimshianTurkishU.S. Virgin IslanderUgandanUkrainianUruguayanUteVenezuelanVietnameseWelshWest IndianYakamaYaquiYugoslavianYumanYup'ikZimbabwean
Immigration
NonimmigrantsImmigrantsAfghanistanAfricaAlbaniaArgentinaArmeniaAsiaAustraliaAustriaBahamasBangladeshBarbadosBelarusBelgiumBelizeBoliviaBosnia and HerzegovinaBrazilBulgariaBurma/MyanmarCabo VerdeCambodiaCameroonCanadaCaribbeanCentral AmericaChileChinaColombiaCongoCosta RicaCroatiaCubaCzechoslovakiaDenmarkDominicaDominican RepublicEastern AfricaEastern AsiaEastern EuropeEcuadorEgyptEl SalvadorEnglandEritreaEthiopiaEuropeFijiFranceGermanyGhanaGreeceGrenadaGuatemalaGuyanaHaitiHondurasHong KongHungaryIndiaIndonesiaIranIraqIrelandIsraelItalyJamaicaJapanKazakhstanKenyaKoreaKuwaitLaosLatin AmericaLatviaLebanonLiberiaLithuaniaMalaysiaMexicoMicronesiaMiddle AfricaMoldovaMoroccoNepalNetherlandsNicaraguaNigeriaNorth AmericaNorth MacedoniaNorthern AfricaNorthern EuropeNorwayOceaniaPakistanPanamaPeruPhilippinesPolandPortugalRomaniaRussiaSaudi ArabiaScotlandSenegalSerbiaSierra LeoneSingaporeSomaliaSouth AfricaSouth AmericaSouth Central AsiaSouth Eastern AsiaSouthern EuropeSpainSri LankaSt. Vincent and the GrenadinesSudanSwedenSwitzerlandSyriaTaiwanThailandTrinidad and TobagoTurkeyUgandaUkraineUruguayUzbekistanVenezuelaVietnamWest IndiesWestern AfricaWestern AsiaWestern EuropeYemenZaireZimbabweAzores
Immigrants from Jordan
Race
Ancestry
AfghanAfricanAlaska NativeAlaskan AthabascanAlbanianAleutAlsatianAmericanApacheArabArapahoArgentineanArmenianAssyrian/Chaldean/SyriacAustralianAustrianBahamianBangladeshiBarbadianBasqueBelgianBelizeanBermudanBhutaneseBlackfeetBolivianBrazilianBritishBritish West IndianBulgarianBurmeseCajunCambodianCanadianCape VerdeanCarpatho RusynCelticCentral AmericanCentral American IndianCherokeeCheyenneChickasawChileanChineseChippewaChoctawColombianColvilleComancheCosta RicanCreeCreekCroatianCrowCubanCypriotCzechCzechoslovakianDanishDelawareDominicanDutchDutch West IndianEastern EuropeanEcuadorianEgyptianEnglishEstonianEthiopianEuropeanFijianFilipinoFinnishFrenchFrench American IndianFrench CanadianGermanGerman RussianGhanaianGreekGuamanian/ChamorroGuatemalanGuyaneseHaitianHmongHonduranHopiHoumaHungarianIcelanderIndian (Asian)IndonesianInupiatIranianIraqiIrishIroquoisIsraeliItalianJamaicanJapaneseJordanianKenyanKiowaKoreanLaotianLatvianLebaneseLiberianLithuanianLumbeeLuxembourgerMacedonianMalaysianMalteseMarshalleseMenomineeMexicanMexican American IndianMongolianMoroccanNative HawaiianNavajoNepaleseNew ZealanderNicaraguanNigerianNorthern EuropeanNorwegianOkinawanOsageOttawaPaiutePakistaniPalestinianPanamanianParaguayanPennsylvania GermanPeruvianPimaPolishPortuguesePotawatomiPuebloPuerto RicanPuget Sound SalishRomanianRussianSalvadoranSamoanScandinavianScotch-IrishScottishSeminoleSenegaleseSerbianShoshoneSierra LeoneanSiouxSlavicSlovakSloveneSomaliSouth AfricanSouth AmericanSouth American IndianSoviet UnionSpaniardSpanishSpanish AmericanSpanish American IndianSri LankanSubsaharan AfricanSudaneseSwedishSwissSyrianTaiwaneseThaiTlingit-HaidaTohono O'OdhamTonganTrinidadian and TobagonianTsimshianTurkishU.S. Virgin IslanderUgandanUkrainianUruguayanUteVenezuelanVietnameseWelshWest IndianYakamaYaquiYugoslavianYumanYup'ikZimbabwean
Immigration
NonimmigrantsImmigrantsAfghanistanAfricaAlbaniaArgentinaArmeniaAsiaAustraliaAustriaBahamasBangladeshBarbadosBelarusBelgiumBelizeBoliviaBosnia and HerzegovinaBrazilBulgariaBurma/MyanmarCabo VerdeCambodiaCameroonCanadaCaribbeanCentral AmericaChileChinaColombiaCongoCosta RicaCroatiaCubaCzechoslovakiaDenmarkDominicaDominican RepublicEastern AfricaEastern AsiaEastern EuropeEcuadorEgyptEl SalvadorEnglandEritreaEthiopiaEuropeFijiFranceGermanyGhanaGreeceGrenadaGuatemalaGuyanaHaitiHondurasHong KongHungaryIndiaIndonesiaIranIraqIrelandIsraelItalyJamaicaJapanJordanKazakhstanKenyaKoreaKuwaitLaosLatin AmericaLatviaLebanonLiberiaLithuaniaMalaysiaMexicoMicronesiaMiddle AfricaMoldovaMoroccoNepalNetherlandsNicaraguaNigeriaNorth AmericaNorth MacedoniaNorthern AfricaNorthern EuropeOceaniaPakistanPanamaPeruPhilippinesPolandPortugalRomaniaRussiaSaudi ArabiaScotlandSenegalSerbiaSierra LeoneSingaporeSomaliaSouth AfricaSouth AmericaSouth Central AsiaSouth Eastern AsiaSouthern EuropeSpainSri LankaSt. Vincent and the GrenadinesSudanSwedenSwitzerlandSyriaTaiwanThailandTrinidad and TobagoTurkeyUgandaUkraineUruguayUzbekistanVenezuelaVietnamWest IndiesWestern AfricaWestern AsiaWestern EuropeYemenZaireZimbabweAzores
8th Grade
Income
Poverty
Unemployment
Labor Participation
Family Structure
Vehicle Availability
Education Level
Disability

8th Grade Comparison

Immigrants from Norway

Immigrants from Jordan

Exceptional
Good
96.2%
8TH GRADE
95.7/ 100
METRIC RATING
118th/ 347
METRIC RANK
95.9%
8TH GRADE
79.5/ 100
METRIC RATING
153rd/ 347
METRIC RANK

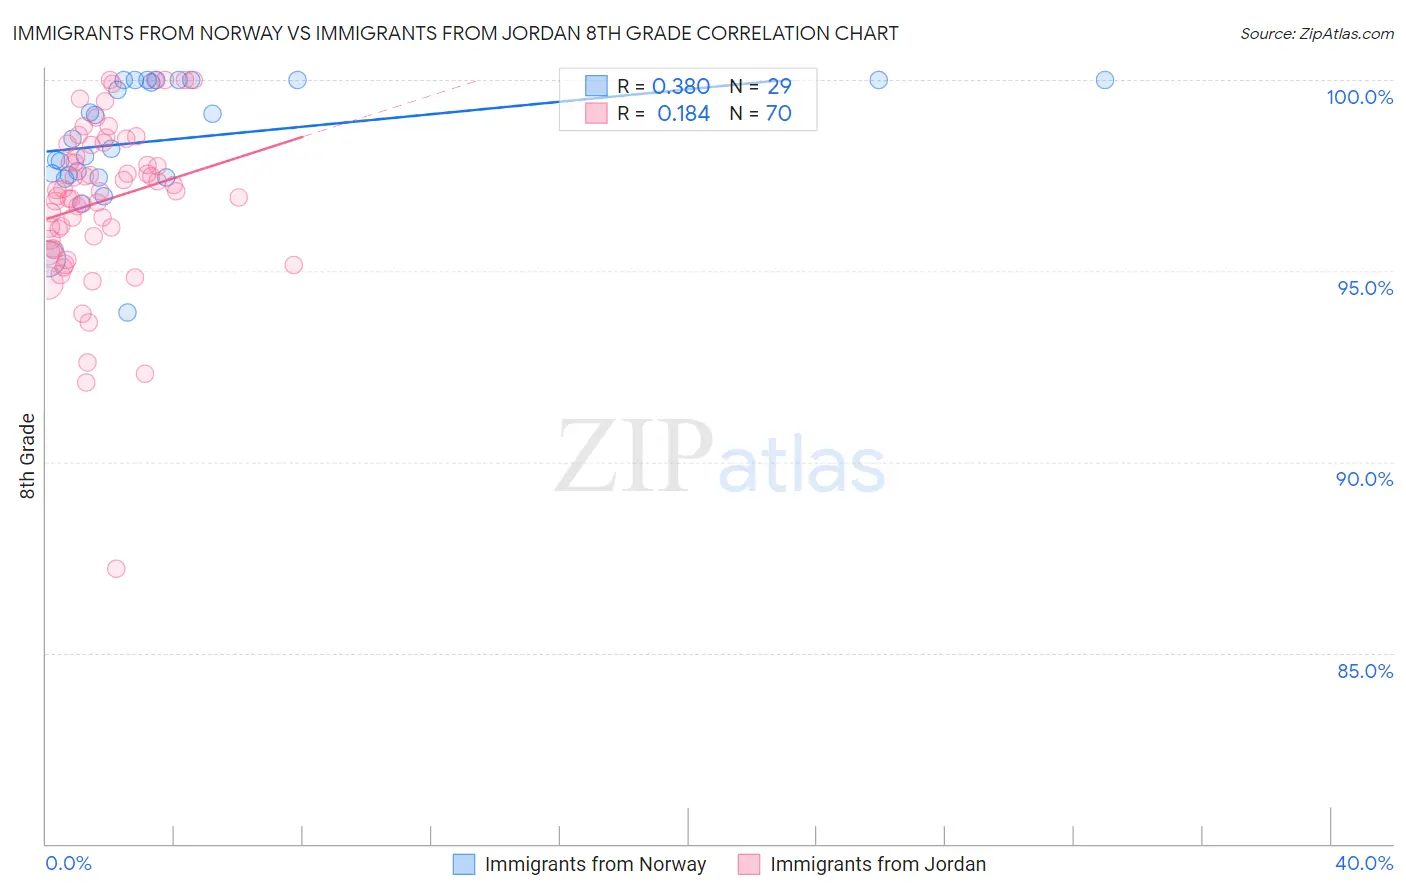
Immigrants from Norway vs Immigrants from Jordan 8th Grade Correlation Chart

The statistical analysis conducted on geographies consisting of 116,716,420 people shows a mild positive correlation between the proportion of Immigrants from Norway and percentage of population with at least 8th grade education in the United States with a correlation coefficient (R) of 0.380 and weighted average of 96.2%. Similarly, the statistical analysis conducted on geographies consisting of 181,269,353 people shows a poor positive correlation between the proportion of Immigrants from Jordan and percentage of population with at least 8th grade education in the United States with a correlation coefficient (R) of 0.184 and weighted average of 95.9%, a difference of 0.28%.
Immigrants from Norway vs Immigrants from Jordan 8th Grade

8th Grade Correlation Summary

MeasurementImmigrants from NorwayImmigrants from Jordan
Minimum93.9%87.2%
Maximum100.0%100.0%
Range6.1%12.8%
Mean98.5%96.8%
Median98.5%97.1%
Interquartile 25% (IQ1)97.5%95.8%
Interquartile 75% (IQ3)100.0%98.3%
Interquartile Range (IQR)2.5%2.5%
Standard Deviation (Sample)1.6%2.2%
Standard Deviation (Population)1.5%2.1%

Similar Demographics by 8th Grade

Demographics Similar to Immigrants from Norway by 8th Grade

In terms of 8th grade, the demographic groups most similar to Immigrants from Norway are Nonimmigrants (96.2%, a difference of 0.010%), Immigrants from Croatia (96.2%, a difference of 0.010%), Immigrants from Switzerland (96.2%, a difference of 0.020%), Immigrants from France (96.2%, a difference of 0.020%), and Immigrants from Bulgaria (96.2%, a difference of 0.020%).
DemographicsRating | Rank8th Grade
Shoshone
96.8
/100
|
#111
Exceptional
96.3%
Syrians
96.7
/100
|
#112
Exceptional
96.3%
Immigrants | Zimbabwe
96.7
/100
|
#113
Exceptional
96.3%
Immigrants | Japan
96.5
/100
|
#114
Exceptional
96.2%
Immigrants | Moldova
96.5
/100
|
#115
Exceptional
96.2%
Immigrants | Nonimmigrants
96.0
/100
|
#116
Exceptional
96.2%
Immigrants | Croatia
96.0
/100
|
#117
Exceptional
96.2%
Immigrants | Norway
95.7
/100
|
#118
Exceptional
96.2%
Immigrants | Switzerland
95.3
/100
|
#119
Exceptional
96.2%
Immigrants | France
95.3
/100
|
#120
Exceptional
96.2%
Immigrants | Bulgaria
95.3
/100
|
#121
Exceptional
96.2%
Immigrants | Europe
95.3
/100
|
#122
Exceptional
96.2%
Filipinos
94.6
/100
|
#123
Exceptional
96.2%
Palestinians
94.6
/100
|
#124
Exceptional
96.2%
Immigrants | Romania
94.1
/100
|
#125
Exceptional
96.2%

Demographics Similar to Immigrants from Jordan by 8th Grade

In terms of 8th grade, the demographic groups most similar to Immigrants from Jordan are Hopi (95.9%, a difference of 0.0%), Immigrants from Russia (96.0%, a difference of 0.010%), Blackfeet (96.0%, a difference of 0.010%), French American Indian (96.0%, a difference of 0.010%), and Immigrants from Israel (96.0%, a difference of 0.020%).
DemographicsRating | Rank8th Grade
Israelis
84.1
/100
|
#146
Excellent
96.0%
Colville
84.0
/100
|
#147
Excellent
96.0%
Albanians
83.1
/100
|
#148
Excellent
96.0%
Immigrants | Israel
81.3
/100
|
#149
Excellent
96.0%
Immigrants | Russia
80.9
/100
|
#150
Excellent
96.0%
Blackfeet
80.8
/100
|
#151
Excellent
96.0%
French American Indians
80.6
/100
|
#152
Excellent
96.0%
Immigrants | Jordan
79.5
/100
|
#153
Good
95.9%
Hopi
79.4
/100
|
#154
Good
95.9%
Kenyans
74.5
/100
|
#155
Good
95.9%
Ugandans
74.1
/100
|
#156
Good
95.9%
Immigrants | Taiwan
70.5
/100
|
#157
Good
95.9%
Arabs
69.4
/100
|
#158
Good
95.9%
Immigrants | Kazakhstan
68.4
/100
|
#159
Good
95.9%
Seminole
67.7
/100
|
#160
Good
95.8%