Immigrants from Norway vs Belizean 4th Grade
COMPARE
Immigrants from Norway
Belizean
4th Grade
4th Grade Comparison
Immigrants from Norway
Belizeans
97.8%
4TH GRADE
94.2/ 100
METRIC RATING
121st/ 347
METRIC RANK
96.1%
4TH GRADE
0.0/ 100
METRIC RATING
319th/ 347
METRIC RANK
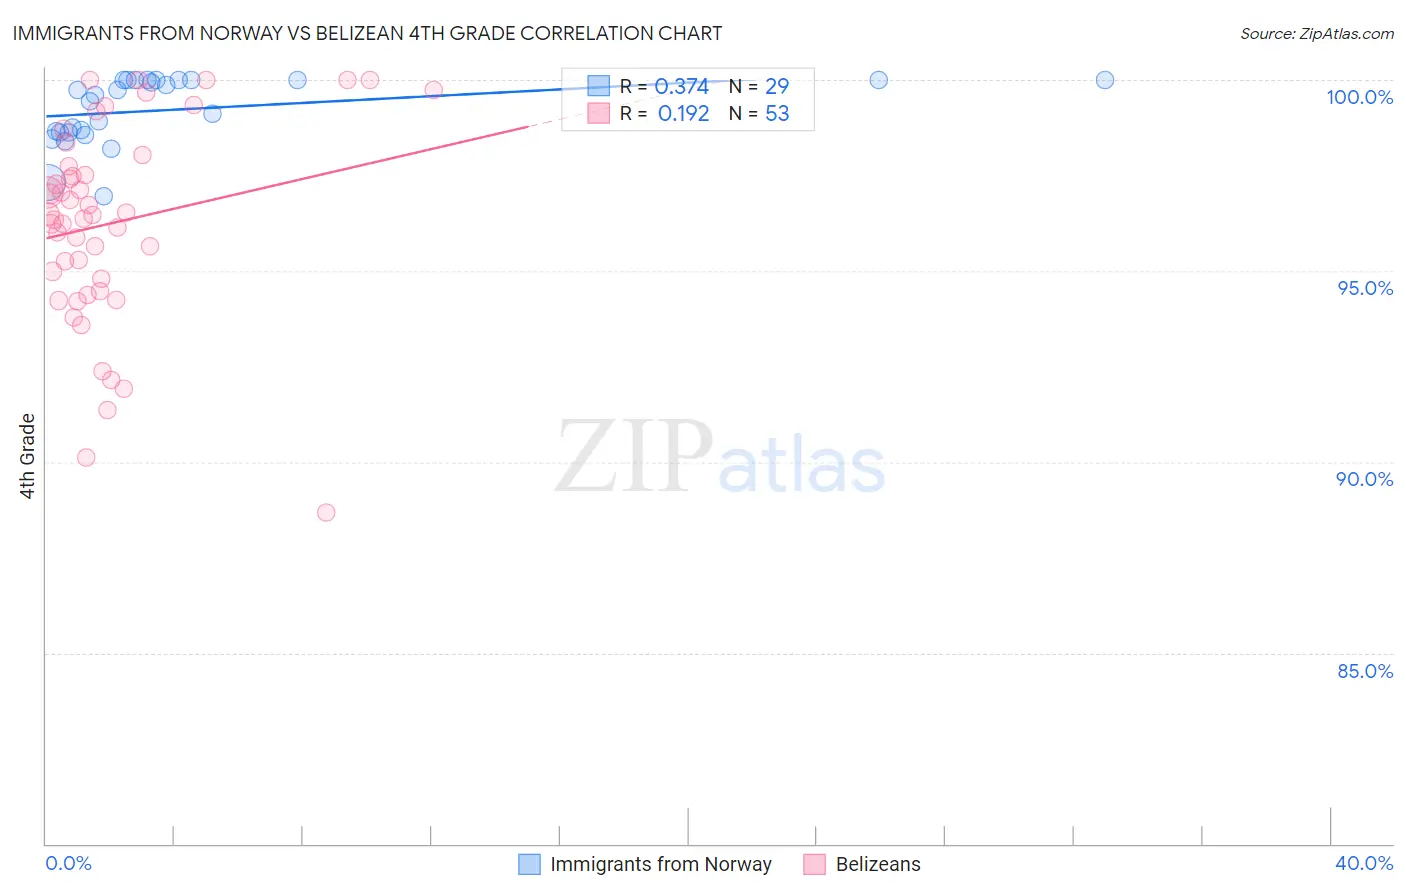
Immigrants from Norway vs Belizean 4th Grade Correlation Chart
The statistical analysis conducted on geographies consisting of 116,716,420 people shows a mild positive correlation between the proportion of Immigrants from Norway and percentage of population with at least 4th grade education in the United States with a correlation coefficient (R) of 0.374 and weighted average of 97.8%. Similarly, the statistical analysis conducted on geographies consisting of 144,224,236 people shows a poor positive correlation between the proportion of Belizeans and percentage of population with at least 4th grade education in the United States with a correlation coefficient (R) of 0.192 and weighted average of 96.1%, a difference of 1.7%.
4th Grade Correlation Summary
| Measurement | Immigrants from Norway | Belizean |
| Minimum | 97.0% | 88.7% |
| Maximum | 100.0% | 100.0% |
| Range | 3.0% | 11.3% |
| Mean | 99.2% | 96.3% |
| Median | 99.6% | 96.5% |
| Interquartile 25% (IQ1) | 98.6% | 94.6% |
| Interquartile 75% (IQ3) | 100.0% | 97.9% |
| Interquartile Range (IQR) | 1.4% | 3.3% |
| Standard Deviation (Sample) | 0.86% | 2.6% |
| Standard Deviation (Population) | 0.85% | 2.6% |
Similar Demographics by 4th Grade
Demographics Similar to Immigrants from Norway by 4th Grade
In terms of 4th grade, the demographic groups most similar to Immigrants from Norway are Immigrants from Japan (97.8%, a difference of 0.0%), Immigrants from Zimbabwe (97.8%, a difference of 0.0%), Syrian (97.8%, a difference of 0.010%), Menominee (97.8%, a difference of 0.010%), and Immigrants from Saudi Arabia (97.8%, a difference of 0.010%).
| Demographics | Rating | Rank | 4th Grade |
| Iroquois | 95.4 /100 | #114 | Exceptional 97.8% |
| Lebanese | 95.4 /100 | #115 | Exceptional 97.8% |
| Immigrants | Croatia | 95.2 /100 | #116 | Exceptional 97.8% |
| Syrians | 94.9 /100 | #117 | Exceptional 97.8% |
| Menominee | 94.9 /100 | #118 | Exceptional 97.8% |
| Immigrants | Saudi Arabia | 94.8 /100 | #119 | Exceptional 97.8% |
| Immigrants | France | 94.8 /100 | #120 | Exceptional 97.8% |
| Immigrants | Norway | 94.2 /100 | #121 | Exceptional 97.8% |
| Immigrants | Japan | 94.1 /100 | #122 | Exceptional 97.8% |
| Immigrants | Zimbabwe | 93.9 /100 | #123 | Exceptional 97.8% |
| Spanish | 93.7 /100 | #124 | Exceptional 97.8% |
| Immigrants | Serbia | 92.6 /100 | #125 | Exceptional 97.8% |
| Immigrants | Europe | 92.5 /100 | #126 | Exceptional 97.8% |
| Colville | 92.3 /100 | #127 | Exceptional 97.7% |
| Pima | 92.0 /100 | #128 | Exceptional 97.7% |
Demographics Similar to Belizeans by 4th Grade
In terms of 4th grade, the demographic groups most similar to Belizeans are Bangladeshi (96.1%, a difference of 0.010%), Immigrants from the Azores (96.1%, a difference of 0.020%), Central American Indian (96.2%, a difference of 0.060%), Immigrants from Ecuador (96.2%, a difference of 0.10%), and Japanese (96.0%, a difference of 0.10%).
| Demographics | Rating | Rank | 4th Grade |
| Cape Verdeans | 0.0 /100 | #312 | Tragic 96.2% |
| Indonesians | 0.0 /100 | #313 | Tragic 96.2% |
| Vietnamese | 0.0 /100 | #314 | Tragic 96.2% |
| Nicaraguans | 0.0 /100 | #315 | Tragic 96.2% |
| Immigrants | Ecuador | 0.0 /100 | #316 | Tragic 96.2% |
| Central American Indians | 0.0 /100 | #317 | Tragic 96.2% |
| Immigrants | Azores | 0.0 /100 | #318 | Tragic 96.1% |
| Belizeans | 0.0 /100 | #319 | Tragic 96.1% |
| Bangladeshis | 0.0 /100 | #320 | Tragic 96.1% |
| Japanese | 0.0 /100 | #321 | Tragic 96.0% |
| Immigrants | Vietnam | 0.0 /100 | #322 | Tragic 96.0% |
| Immigrants | Nicaragua | 0.0 /100 | #323 | Tragic 96.0% |
| Immigrants | Belize | 0.0 /100 | #324 | Tragic 96.0% |
| Dominicans | 0.0 /100 | #325 | Tragic 96.0% |
| Hispanics or Latinos | 0.0 /100 | #326 | Tragic 96.0% |