Immigrants from Northern Europe vs Irish 3rd Grade

COMPARE

Immigrants from Northern Europe
Race
Ancestry
AfghanAfricanAlaska NativeAlaskan AthabascanAlbanianAleutAlsatianAmericanApacheArabArapahoArgentineanArmenianAssyrian/Chaldean/SyriacAustralianAustrianBahamianBangladeshiBarbadianBasqueBelgianBelizeanBermudanBhutaneseBlackfeetBolivianBrazilianBritishBritish West IndianBulgarianBurmeseCajunCambodianCanadianCape VerdeanCarpatho RusynCelticCentral AmericanCentral American IndianCherokeeCheyenneChickasawChileanChineseChippewaChoctawColombianColvilleComancheCosta RicanCreeCreekCroatianCrowCubanCypriotCzechCzechoslovakianDanishDelawareDominicanDutchDutch West IndianEastern EuropeanEcuadorianEgyptianEnglishEstonianEthiopianEuropeanFijianFilipinoFinnishFrenchFrench American IndianFrench CanadianGermanGerman RussianGhanaianGreekGuamanian/ChamorroGuatemalanGuyaneseHaitianHmongHonduranHopiHoumaHungarianIcelanderIndian (Asian)IndonesianInupiatIranianIraqiIroquoisIsraeliItalianJamaicanJapaneseJordanianKenyanKiowaKoreanLaotianLatvianLebaneseLiberianLithuanianLumbeeLuxembourgerMacedonianMalaysianMalteseMarshalleseMenomineeMexicanMexican American IndianMongolianMoroccanNative HawaiianNavajoNepaleseNew ZealanderNicaraguanNigerianNorthern EuropeanNorwegianOkinawanOsageOttawaPaiutePakistaniPalestinianPanamanianParaguayanPennsylvania GermanPeruvianPimaPolishPortuguesePotawatomiPuebloPuerto RicanPuget Sound SalishRomanianRussianSalvadoranSamoanScandinavianScotch-IrishScottishSeminoleSenegaleseSerbianShoshoneSierra LeoneanSiouxSlavicSlovakSloveneSomaliSouth AfricanSouth AmericanSouth American IndianSoviet UnionSpaniardSpanishSpanish AmericanSpanish American IndianSri LankanSubsaharan AfricanSudaneseSwedishSwissSyrianTaiwaneseThaiTlingit-HaidaTohono O'OdhamTonganTrinidadian and TobagonianTsimshianTurkishU.S. Virgin IslanderUgandanUkrainianUruguayanUteVenezuelanVietnameseWelshWest IndianYakamaYaquiYugoslavianYumanYup'ikZimbabwean
Immigration
NonimmigrantsImmigrantsAfghanistanAfricaAlbaniaArgentinaArmeniaAsiaAustraliaAustriaBahamasBangladeshBarbadosBelarusBelgiumBelizeBoliviaBosnia and HerzegovinaBrazilBulgariaBurma/MyanmarCabo VerdeCambodiaCameroonCanadaCaribbeanCentral AmericaChileChinaColombiaCongoCosta RicaCroatiaCubaCzechoslovakiaDenmarkDominicaDominican RepublicEastern AfricaEastern AsiaEastern EuropeEcuadorEgyptEl SalvadorEnglandEritreaEthiopiaEuropeFijiFranceGermanyGhanaGreeceGrenadaGuatemalaGuyanaHaitiHondurasHong KongHungaryIndiaIndonesiaIranIraqIrelandIsraelItalyJamaicaJapanJordanKazakhstanKenyaKoreaKuwaitLaosLatin AmericaLatviaLebanonLiberiaLithuaniaMalaysiaMexicoMicronesiaMiddle AfricaMoldovaMoroccoNepalNetherlandsNicaraguaNigeriaNorth AmericaNorth MacedoniaNorthern AfricaNorthern EuropeNorwayOceaniaPakistanPanamaPeruPhilippinesPolandPortugalRomaniaRussiaSaudi ArabiaScotlandSenegalSerbiaSierra LeoneSingaporeSomaliaSouth AfricaSouth AmericaSouth Central AsiaSouth Eastern AsiaSouthern EuropeSpainSri LankaSt. Vincent and the GrenadinesSudanSwedenSwitzerlandSyriaTaiwanThailandTrinidad and TobagoTurkeyUgandaUkraineUruguayUzbekistanVenezuelaVietnamWest IndiesWestern AfricaWestern AsiaWestern EuropeYemenZaireZimbabweAzores
Irish
Race
Ancestry
AfghanAfricanAlaska NativeAlaskan AthabascanAlbanianAleutAlsatianAmericanApacheArabArapahoArgentineanArmenianAssyrian/Chaldean/SyriacAustralianAustrianBahamianBangladeshiBarbadianBasqueBelgianBelizeanBermudanBhutaneseBlackfeetBolivianBrazilianBritishBritish West IndianBulgarianBurmeseCajunCambodianCanadianCape VerdeanCarpatho RusynCelticCentral AmericanCentral American IndianCherokeeCheyenneChickasawChileanChineseChippewaChoctawColombianColvilleComancheCosta RicanCreeCreekCroatianCrowCubanCypriotCzechCzechoslovakianDanishDelawareDominicanDutchDutch West IndianEastern EuropeanEcuadorianEgyptianEnglishEstonianEthiopianEuropeanFijianFilipinoFinnishFrenchFrench American IndianFrench CanadianGermanGerman RussianGhanaianGreekGuamanian/ChamorroGuatemalanGuyaneseHaitianHmongHonduranHopiHoumaHungarianIcelanderIndian (Asian)IndonesianInupiatIranianIraqiIrishIroquoisIsraeliItalianJamaicanJapaneseJordanianKenyanKiowaKoreanLaotianLatvianLebaneseLiberianLithuanianLumbeeLuxembourgerMacedonianMalaysianMalteseMarshalleseMenomineeMexicanMexican American IndianMongolianMoroccanNative HawaiianNavajoNepaleseNew ZealanderNicaraguanNigerianNorthern EuropeanNorwegianOkinawanOsageOttawaPaiutePakistaniPalestinianPanamanianParaguayanPennsylvania GermanPeruvianPimaPolishPortuguesePotawatomiPuebloPuerto RicanPuget Sound SalishRomanianRussianSalvadoranSamoanScandinavianScotch-IrishScottishSeminoleSenegaleseSerbianShoshoneSierra LeoneanSiouxSlavicSlovakSloveneSomaliSouth AfricanSouth AmericanSouth American IndianSoviet UnionSpaniardSpanishSpanish AmericanSpanish American IndianSri LankanSubsaharan AfricanSudaneseSwedishSwissSyrianTaiwaneseThaiTlingit-HaidaTohono O'OdhamTonganTrinidadian and TobagonianTsimshianTurkishU.S. Virgin IslanderUgandanUkrainianUruguayanUteVenezuelanVietnameseWelshWest IndianYakamaYaquiYugoslavianYumanYup'ikZimbabwean
Immigration
NonimmigrantsImmigrantsAfghanistanAfricaAlbaniaArgentinaArmeniaAsiaAustraliaAustriaBahamasBangladeshBarbadosBelarusBelgiumBelizeBoliviaBosnia and HerzegovinaBrazilBulgariaBurma/MyanmarCabo VerdeCambodiaCameroonCanadaCaribbeanCentral AmericaChileChinaColombiaCongoCosta RicaCroatiaCubaCzechoslovakiaDenmarkDominicaDominican RepublicEastern AfricaEastern AsiaEastern EuropeEcuadorEgyptEl SalvadorEnglandEritreaEthiopiaEuropeFijiFranceGermanyGhanaGreeceGrenadaGuatemalaGuyanaHaitiHondurasHong KongHungaryIndiaIndonesiaIranIraqIrelandIsraelItalyJamaicaJapanJordanKazakhstanKenyaKoreaKuwaitLaosLatin AmericaLatviaLebanonLiberiaLithuaniaMalaysiaMexicoMicronesiaMiddle AfricaMoldovaMoroccoNepalNetherlandsNicaraguaNigeriaNorth AmericaNorth MacedoniaNorthern AfricaNorwayOceaniaPakistanPanamaPeruPhilippinesPolandPortugalRomaniaRussiaSaudi ArabiaScotlandSenegalSerbiaSierra LeoneSingaporeSomaliaSouth AfricaSouth AmericaSouth Central AsiaSouth Eastern AsiaSouthern EuropeSpainSri LankaSt. Vincent and the GrenadinesSudanSwedenSwitzerlandSyriaTaiwanThailandTrinidad and TobagoTurkeyUgandaUkraineUruguayUzbekistanVenezuelaVietnamWest IndiesWestern AfricaWestern AsiaWestern EuropeYemenZaireZimbabweAzores
3rd Grade
Income
Poverty
Unemployment
Labor Participation
Family Structure
Vehicle Availability
Education Level
Disability

3rd Grade Comparison

Immigrants from Northern Europe

Irish

Exceptional
Exceptional
98.2%
3RD GRADE
99.6/ 100
METRIC RATING
68th/ 347
METRIC RANK
98.5%
3RD GRADE
100.0/ 100
METRIC RATING
18th/ 347
METRIC RANK

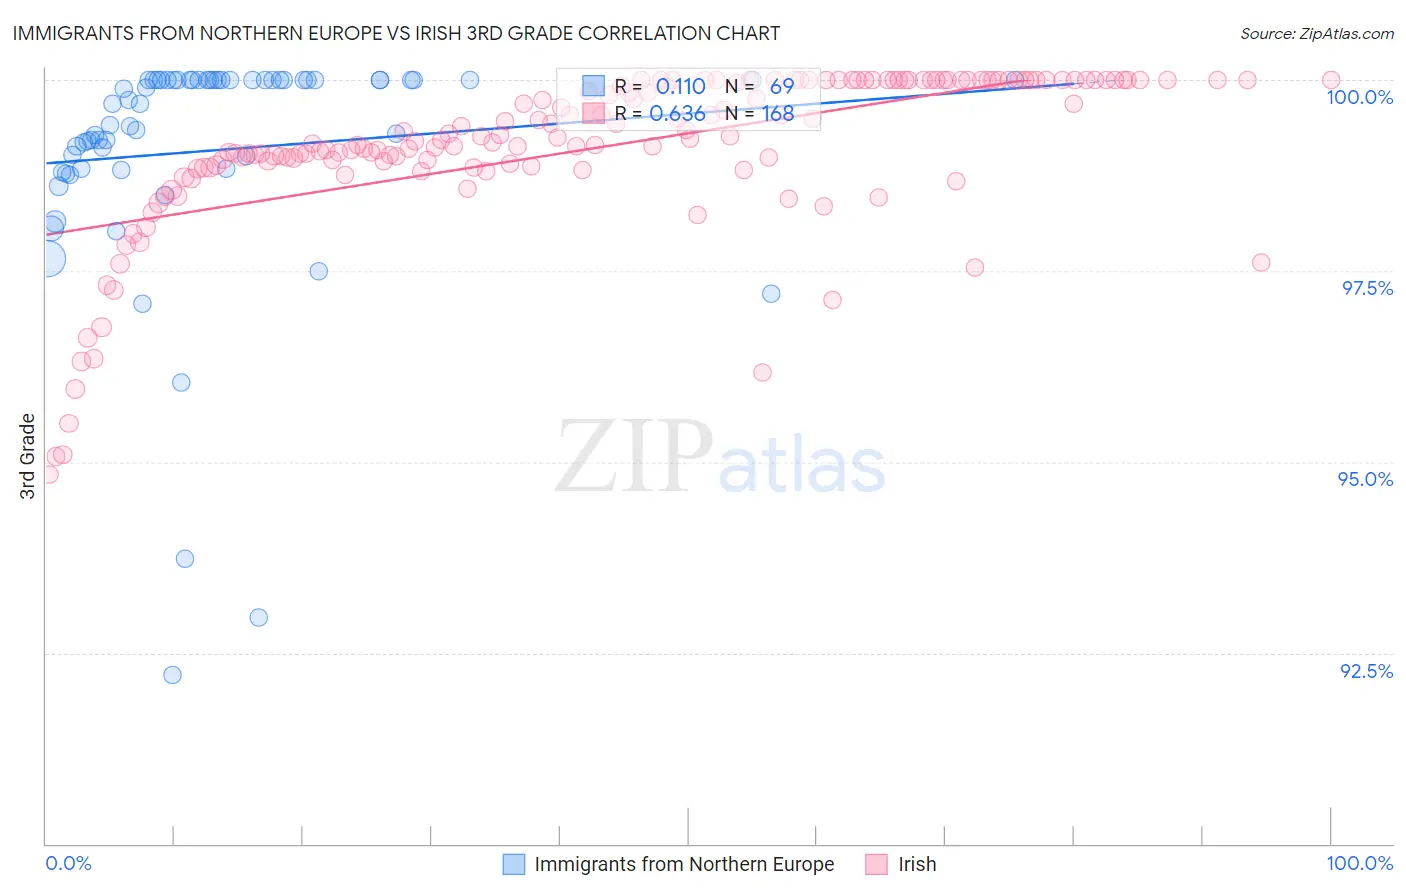
Immigrants from Northern Europe vs Irish 3rd Grade Correlation Chart

The statistical analysis conducted on geographies consisting of 477,226,800 people shows a poor positive correlation between the proportion of Immigrants from Northern Europe and percentage of population with at least 3rd grade education in the United States with a correlation coefficient (R) of 0.110 and weighted average of 98.2%. Similarly, the statistical analysis conducted on geographies consisting of 580,708,963 people shows a significant positive correlation between the proportion of Irish and percentage of population with at least 3rd grade education in the United States with a correlation coefficient (R) of 0.636 and weighted average of 98.5%, a difference of 0.28%.
Immigrants from Northern Europe vs Irish 3rd Grade

3rd Grade Correlation Summary

MeasurementImmigrants from Northern EuropeIrish
Minimum92.2%94.8%
Maximum100.0%100.0%
Range7.8%5.2%
Mean99.1%99.1%
Median99.7%99.2%
Interquartile 25% (IQ1)98.8%98.9%
Interquartile 75% (IQ3)100.0%100.0%
Interquartile Range (IQR)1.2%1.1%
Standard Deviation (Sample)1.6%1.1%
Standard Deviation (Population)1.6%1.1%

Similar Demographics by 3rd Grade

Demographics Similar to Immigrants from Northern Europe by 3rd Grade

In terms of 3rd grade, the demographic groups most similar to Immigrants from Northern Europe are New Zealander (98.2%, a difference of 0.0%), Serbian (98.2%, a difference of 0.0%), Russian (98.2%, a difference of 0.0%), Canadian (98.2%, a difference of 0.0%), and Cajun (98.2%, a difference of 0.0%).
DemographicsRating | Rank3rd Grade
Pueblo
99.7
/100
|
#61
Exceptional
98.2%
Immigrants | Canada
99.7
/100
|
#62
Exceptional
98.2%
Immigrants | North America
99.7
/100
|
#63
Exceptional
98.2%
Kiowa
99.6
/100
|
#64
Exceptional
98.2%
New Zealanders
99.6
/100
|
#65
Exceptional
98.2%
Serbians
99.6
/100
|
#66
Exceptional
98.2%
Russians
99.6
/100
|
#67
Exceptional
98.2%
Immigrants | Northern Europe
99.6
/100
|
#68
Exceptional
98.2%
Canadians
99.6
/100
|
#69
Exceptional
98.2%
Cajuns
99.6
/100
|
#70
Exceptional
98.2%
Immigrants | Austria
99.6
/100
|
#71
Exceptional
98.2%
Chickasaw
99.5
/100
|
#72
Exceptional
98.2%
Cheyenne
99.3
/100
|
#73
Exceptional
98.2%
Immigrants | Netherlands
99.3
/100
|
#74
Exceptional
98.2%
Cherokee
99.3
/100
|
#75
Exceptional
98.2%

Demographics Similar to Irish by 3rd Grade

In terms of 3rd grade, the demographic groups most similar to Irish are Dutch (98.5%, a difference of 0.010%), Polish (98.5%, a difference of 0.010%), Pennsylvania German (98.5%, a difference of 0.010%), Lithuanian (98.5%, a difference of 0.010%), and Scottish (98.5%, a difference of 0.020%).
DemographicsRating | Rank3rd Grade
Slovenes
100.0
/100
|
#11
Exceptional
98.6%
English
100.0
/100
|
#12
Exceptional
98.6%
Tlingit-Haida
100.0
/100
|
#13
Exceptional
98.5%
Carpatho Rusyns
100.0
/100
|
#14
Exceptional
98.5%
Swedes
100.0
/100
|
#15
Exceptional
98.5%
Scottish
100.0
/100
|
#16
Exceptional
98.5%
Dutch
100.0
/100
|
#17
Exceptional
98.5%
Irish
100.0
/100
|
#18
Exceptional
98.5%
Poles
100.0
/100
|
#19
Exceptional
98.5%
Pennsylvania Germans
100.0
/100
|
#20
Exceptional
98.5%
Lithuanians
100.0
/100
|
#21
Exceptional
98.5%
Finns
100.0
/100
|
#22
Exceptional
98.5%
Sioux
100.0
/100
|
#23
Exceptional
98.5%
Danes
100.0
/100
|
#24
Exceptional
98.5%
Scotch-Irish
100.0
/100
|
#25
Exceptional
98.5%