Immigrants from Northern Europe vs Immigrants from Africa Bachelor's Degree

COMPARE

Immigrants from Northern Europe
Race
Ancestry
AfghanAfricanAlaska NativeAlaskan AthabascanAlbanianAleutAlsatianAmericanApacheArabArapahoArgentineanArmenianAssyrian/Chaldean/SyriacAustralianAustrianBahamianBangladeshiBarbadianBasqueBelgianBelizeanBermudanBhutaneseBlackfeetBolivianBrazilianBritishBritish West IndianBulgarianBurmeseCajunCambodianCanadianCape VerdeanCarpatho RusynCelticCentral AmericanCentral American IndianCherokeeCheyenneChickasawChileanChineseChippewaChoctawColombianColvilleComancheCosta RicanCreeCreekCroatianCrowCubanCypriotCzechCzechoslovakianDanishDelawareDominicanDutchDutch West IndianEastern EuropeanEcuadorianEgyptianEnglishEstonianEthiopianEuropeanFijianFilipinoFinnishFrenchFrench American IndianFrench CanadianGermanGerman RussianGhanaianGreekGuamanian/ChamorroGuatemalanGuyaneseHaitianHmongHonduranHopiHoumaHungarianIcelanderIndian (Asian)IndonesianInupiatIranianIraqiIrishIroquoisIsraeliItalianJamaicanJapaneseJordanianKenyanKiowaKoreanLaotianLatvianLebaneseLiberianLithuanianLumbeeLuxembourgerMacedonianMalaysianMalteseMarshalleseMenomineeMexicanMexican American IndianMongolianMoroccanNative HawaiianNavajoNepaleseNew ZealanderNicaraguanNigerianNorthern EuropeanNorwegianOkinawanOsageOttawaPaiutePakistaniPalestinianPanamanianParaguayanPennsylvania GermanPeruvianPimaPolishPortuguesePotawatomiPuebloPuerto RicanPuget Sound SalishRomanianRussianSalvadoranSamoanScandinavianScotch-IrishScottishSeminoleSenegaleseSerbianShoshoneSierra LeoneanSiouxSlavicSlovakSloveneSomaliSouth AfricanSouth AmericanSouth American IndianSoviet UnionSpaniardSpanishSpanish AmericanSpanish American IndianSri LankanSubsaharan AfricanSudaneseSwedishSwissSyrianTaiwaneseThaiTlingit-HaidaTohono O'OdhamTonganTrinidadian and TobagonianTsimshianTurkishU.S. Virgin IslanderUgandanUkrainianUruguayanUteVenezuelanVietnameseWelshWest IndianYakamaYaquiYugoslavianYumanYup'ikZimbabwean
Immigration
NonimmigrantsImmigrantsAfghanistanAlbaniaArgentinaArmeniaAsiaAustraliaAustriaBahamasBangladeshBarbadosBelarusBelgiumBelizeBoliviaBosnia and HerzegovinaBrazilBulgariaBurma/MyanmarCabo VerdeCambodiaCameroonCanadaCaribbeanCentral AmericaChileChinaColombiaCongoCosta RicaCroatiaCubaCzechoslovakiaDenmarkDominicaDominican RepublicEastern AfricaEastern AsiaEastern EuropeEcuadorEgyptEl SalvadorEnglandEritreaEthiopiaEuropeFijiFranceGermanyGhanaGreeceGrenadaGuatemalaGuyanaHaitiHondurasHong KongHungaryIndiaIndonesiaIranIraqIrelandIsraelItalyJamaicaJapanJordanKazakhstanKenyaKoreaKuwaitLaosLatin AmericaLatviaLebanonLiberiaLithuaniaMalaysiaMexicoMicronesiaMiddle AfricaMoldovaMoroccoNepalNetherlandsNicaraguaNigeriaNorth AmericaNorth MacedoniaNorthern AfricaNorthern EuropeNorwayOceaniaPakistanPanamaPeruPhilippinesPolandPortugalRomaniaRussiaSaudi ArabiaScotlandSenegalSerbiaSierra LeoneSingaporeSomaliaSouth AfricaSouth AmericaSouth Central AsiaSouth Eastern AsiaSouthern EuropeSpainSri LankaSt. Vincent and the GrenadinesSudanSwedenSwitzerlandSyriaTaiwanThailandTrinidad and TobagoTurkeyUgandaUkraineUruguayUzbekistanVenezuelaVietnamWest IndiesWestern AfricaWestern AsiaWestern EuropeYemenZaireZimbabweAzores
Immigrants from Africa
Race
Ancestry
AfghanAfricanAlaska NativeAlaskan AthabascanAlbanianAleutAlsatianAmericanApacheArabArapahoArgentineanArmenianAssyrian/Chaldean/SyriacAustralianAustrianBahamianBangladeshiBarbadianBasqueBelgianBelizeanBermudanBhutaneseBlackfeetBolivianBrazilianBritishBritish West IndianBulgarianBurmeseCajunCambodianCanadianCape VerdeanCarpatho RusynCelticCentral AmericanCentral American IndianCherokeeCheyenneChickasawChileanChineseChippewaChoctawColombianColvilleComancheCosta RicanCreeCreekCroatianCrowCubanCypriotCzechCzechoslovakianDanishDelawareDominicanDutchDutch West IndianEastern EuropeanEcuadorianEgyptianEnglishEstonianEthiopianEuropeanFijianFilipinoFinnishFrenchFrench American IndianFrench CanadianGermanGerman RussianGhanaianGreekGuamanian/ChamorroGuatemalanGuyaneseHaitianHmongHonduranHopiHoumaHungarianIcelanderIndian (Asian)IndonesianInupiatIranianIraqiIrishIroquoisIsraeliItalianJamaicanJapaneseJordanianKenyanKiowaKoreanLaotianLatvianLebaneseLiberianLithuanianLumbeeLuxembourgerMacedonianMalaysianMalteseMarshalleseMenomineeMexicanMexican American IndianMongolianMoroccanNative HawaiianNavajoNepaleseNew ZealanderNicaraguanNigerianNorthern EuropeanNorwegianOkinawanOsageOttawaPaiutePakistaniPalestinianPanamanianParaguayanPennsylvania GermanPeruvianPimaPolishPortuguesePotawatomiPuebloPuerto RicanPuget Sound SalishRomanianRussianSalvadoranSamoanScandinavianScotch-IrishScottishSeminoleSenegaleseSerbianShoshoneSierra LeoneanSiouxSlavicSlovakSloveneSomaliSouth AfricanSouth AmericanSouth American IndianSoviet UnionSpaniardSpanishSpanish AmericanSpanish American IndianSri LankanSubsaharan AfricanSudaneseSwedishSwissSyrianTaiwaneseThaiTlingit-HaidaTohono O'OdhamTonganTrinidadian and TobagonianTsimshianTurkishU.S. Virgin IslanderUgandanUkrainianUruguayanUteVenezuelanVietnameseWelshWest IndianYakamaYaquiYugoslavianYumanYup'ikZimbabwean
Immigration
NonimmigrantsImmigrantsAfghanistanAfricaAlbaniaArgentinaArmeniaAsiaAustraliaAustriaBahamasBangladeshBarbadosBelarusBelgiumBelizeBoliviaBosnia and HerzegovinaBrazilBulgariaBurma/MyanmarCabo VerdeCambodiaCameroonCanadaCaribbeanCentral AmericaChileChinaColombiaCongoCosta RicaCroatiaCubaCzechoslovakiaDenmarkDominicaDominican RepublicEastern AfricaEastern AsiaEastern EuropeEcuadorEgyptEl SalvadorEnglandEritreaEthiopiaEuropeFijiFranceGermanyGhanaGreeceGrenadaGuatemalaGuyanaHaitiHondurasHong KongHungaryIndiaIndonesiaIranIraqIrelandIsraelItalyJamaicaJapanJordanKazakhstanKenyaKoreaKuwaitLaosLatin AmericaLatviaLebanonLiberiaLithuaniaMalaysiaMexicoMicronesiaMiddle AfricaMoldovaMoroccoNepalNetherlandsNicaraguaNigeriaNorth AmericaNorth MacedoniaNorthern AfricaNorwayOceaniaPakistanPanamaPeruPhilippinesPolandPortugalRomaniaRussiaSaudi ArabiaScotlandSenegalSerbiaSierra LeoneSingaporeSomaliaSouth AfricaSouth AmericaSouth Central AsiaSouth Eastern AsiaSouthern EuropeSpainSri LankaSt. Vincent and the GrenadinesSudanSwedenSwitzerlandSyriaTaiwanThailandTrinidad and TobagoTurkeyUgandaUkraineUruguayUzbekistanVenezuelaVietnamWest IndiesWestern AfricaWestern AsiaWestern EuropeYemenZaireZimbabweAzores
Bachelor's Degree
Income
Poverty
Unemployment
Labor Participation
Family Structure
Vehicle Availability
Education Level
Disability

Bachelor's Degree Comparison

Immigrants from Northern Europe

Immigrants from Africa

Exceptional
Good
45.6%
BACHELOR'S DEGREE
100.0/ 100
METRIC RATING
33rd/ 347
METRIC RANK
38.9%
BACHELOR'S DEGREE
76.5/ 100
METRIC RATING
151st/ 347
METRIC RANK

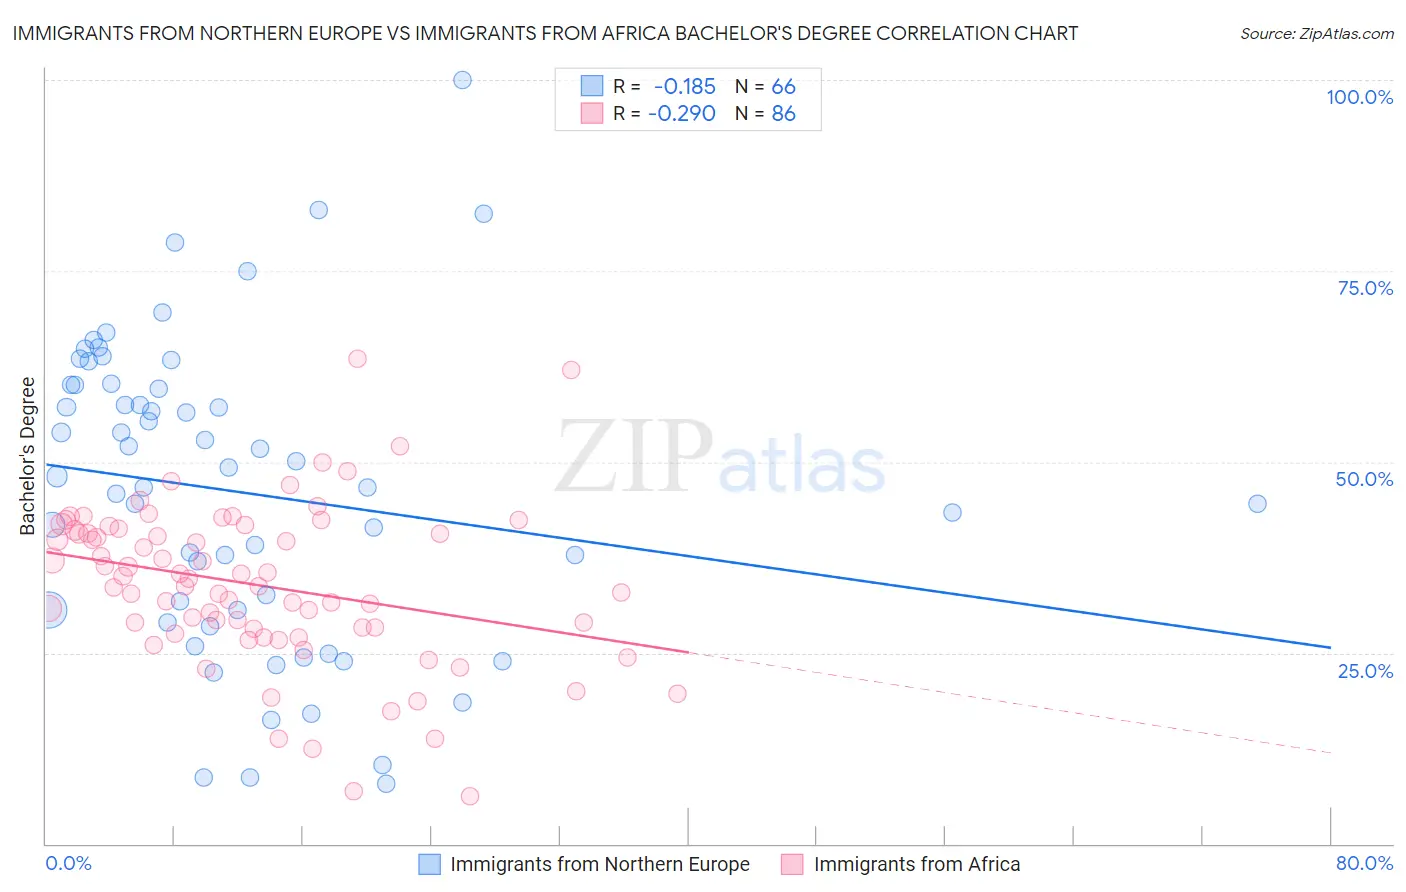
Immigrants from Northern Europe vs Immigrants from Africa Bachelor's Degree Correlation Chart

The statistical analysis conducted on geographies consisting of 477,184,497 people shows a poor negative correlation between the proportion of Immigrants from Northern Europe and percentage of population with at least bachelor's degree education in the United States with a correlation coefficient (R) of -0.185 and weighted average of 45.6%. Similarly, the statistical analysis conducted on geographies consisting of 469,379,940 people shows a weak negative correlation between the proportion of Immigrants from Africa and percentage of population with at least bachelor's degree education in the United States with a correlation coefficient (R) of -0.290 and weighted average of 38.9%, a difference of 17.3%.
Immigrants from Northern Europe vs Immigrants from Africa Bachelor's Degree

Bachelor's Degree Correlation Summary

MeasurementImmigrants from Northern EuropeImmigrants from Africa
Minimum7.8%6.2%
Maximum100.0%63.5%
Range92.2%57.3%
Mean46.0%33.9%
Median47.4%34.2%
Interquartile 25% (IQ1)30.6%28.2%
Interquartile 75% (IQ3)60.1%41.0%
Interquartile Range (IQR)29.5%12.9%
Standard Deviation (Sample)20.0%10.5%
Standard Deviation (Population)19.8%10.4%

Similar Demographics by Bachelor's Degree

Demographics Similar to Immigrants from Northern Europe by Bachelor's Degree

In terms of bachelor's degree, the demographic groups most similar to Immigrants from Northern Europe are Immigrants from Denmark (45.4%, a difference of 0.45%), Immigrants from Russia (45.4%, a difference of 0.48%), Mongolian (45.4%, a difference of 0.50%), Russian (45.3%, a difference of 0.65%), and Immigrants from Turkey (46.0%, a difference of 0.70%).
DemographicsRating | RankBachelor's Degree
Immigrants | Japan
100.0
/100
|
#26
Exceptional
46.8%
Immigrants | France
100.0
/100
|
#27
Exceptional
46.4%
Turks
100.0
/100
|
#28
Exceptional
46.2%
Israelis
100.0
/100
|
#29
Exceptional
46.1%
Immigrants | Sri Lanka
100.0
/100
|
#30
Exceptional
46.1%
Latvians
100.0
/100
|
#31
Exceptional
46.1%
Immigrants | Turkey
100.0
/100
|
#32
Exceptional
46.0%
Immigrants | Northern Europe
100.0
/100
|
#33
Exceptional
45.6%
Immigrants | Denmark
100.0
/100
|
#34
Exceptional
45.4%
Immigrants | Russia
100.0
/100
|
#35
Exceptional
45.4%
Mongolians
100.0
/100
|
#36
Exceptional
45.4%
Russians
100.0
/100
|
#37
Exceptional
45.3%
Bulgarians
100.0
/100
|
#38
Exceptional
45.3%
Immigrants | Latvia
100.0
/100
|
#39
Exceptional
45.1%
Immigrants | Belarus
100.0
/100
|
#40
Exceptional
45.0%

Demographics Similar to Immigrants from Africa by Bachelor's Degree

In terms of bachelor's degree, the demographic groups most similar to Immigrants from Africa are Sudanese (38.9%, a difference of 0.020%), Slavic (38.9%, a difference of 0.080%), South American (38.9%, a difference of 0.10%), Immigrants from Poland (39.0%, a difference of 0.13%), and Canadian (38.8%, a difference of 0.20%).
DemographicsRating | RankBachelor's Degree
Immigrants | Afghanistan
79.7
/100
|
#144
Good
39.1%
Slovenes
79.5
/100
|
#145
Good
39.1%
Swedes
79.2
/100
|
#146
Good
39.1%
Immigrants | Sierra Leone
79.0
/100
|
#147
Good
39.0%
Iraqis
78.1
/100
|
#148
Good
39.0%
Immigrants | Poland
77.5
/100
|
#149
Good
39.0%
South Americans
77.3
/100
|
#150
Good
38.9%
Immigrants | Africa
76.5
/100
|
#151
Good
38.9%
Sudanese
76.4
/100
|
#152
Good
38.9%
Slavs
75.9
/100
|
#153
Good
38.9%
Canadians
75.0
/100
|
#154
Good
38.8%
Immigrants | Kenya
73.8
/100
|
#155
Good
38.8%
Kenyans
72.5
/100
|
#156
Good
38.7%
Immigrants | South America
70.1
/100
|
#157
Good
38.6%
Immigrants | Germany
69.6
/100
|
#158
Good
38.6%