Immigrants from North Macedonia vs Trinidadian and Tobagonian 10th Grade
COMPARE
Immigrants from North Macedonia
Trinidadian and Tobagonian
10th Grade
10th Grade Comparison
Immigrants from North Macedonia
Trinidadians and Tobagonians
94.5%
10TH GRADE
97.2/ 100
METRIC RATING
108th/ 347
METRIC RANK
92.4%
10TH GRADE
0.2/ 100
METRIC RATING
273rd/ 347
METRIC RANK
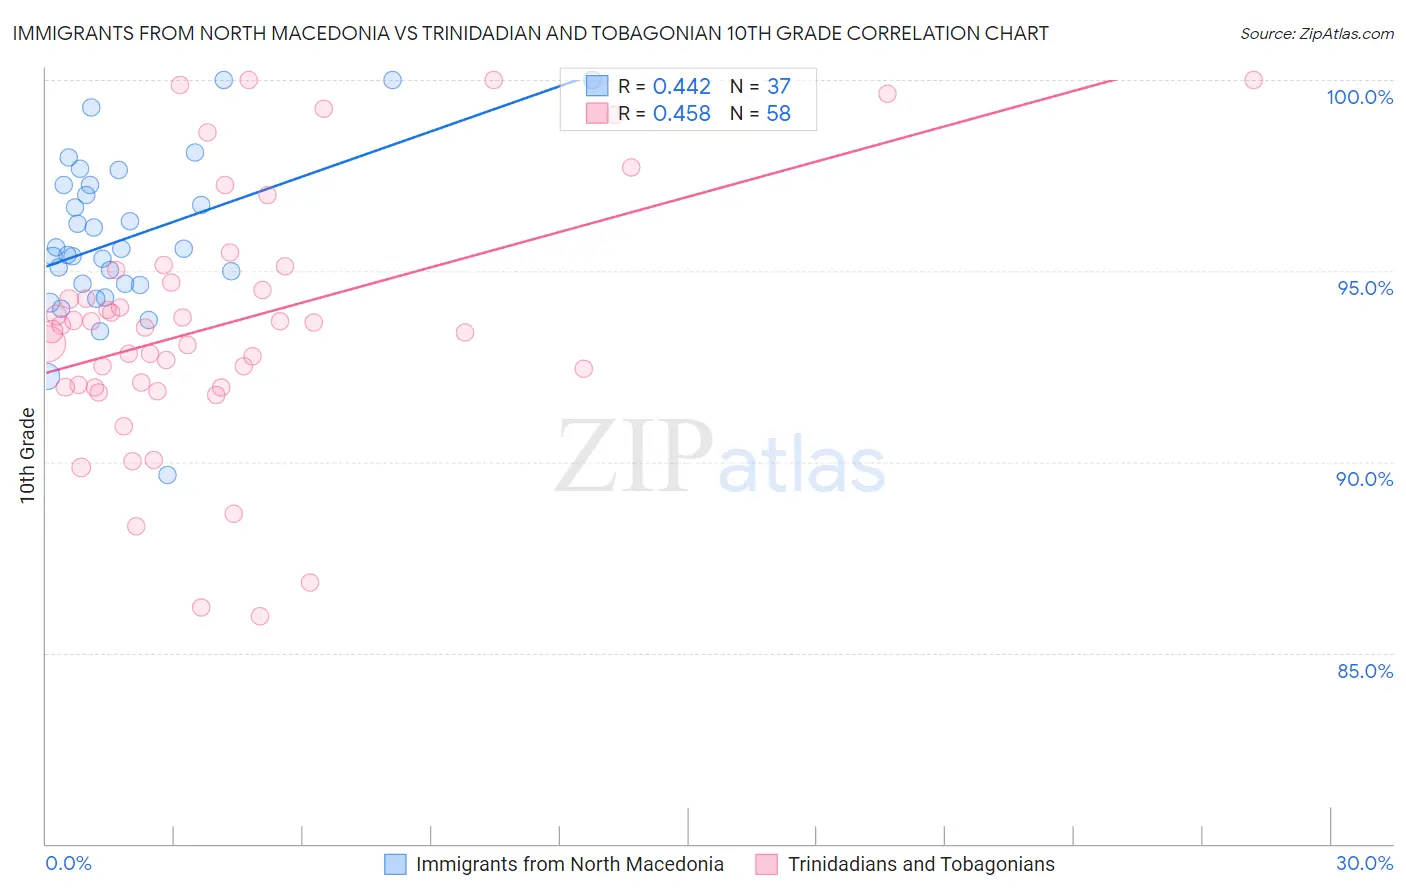
Immigrants from North Macedonia vs Trinidadian and Tobagonian 10th Grade Correlation Chart
The statistical analysis conducted on geographies consisting of 74,300,344 people shows a moderate positive correlation between the proportion of Immigrants from North Macedonia and percentage of population with at least 10th grade education in the United States with a correlation coefficient (R) of 0.442 and weighted average of 94.5%. Similarly, the statistical analysis conducted on geographies consisting of 219,881,170 people shows a moderate positive correlation between the proportion of Trinidadians and Tobagonians and percentage of population with at least 10th grade education in the United States with a correlation coefficient (R) of 0.458 and weighted average of 92.4%, a difference of 2.2%.
10th Grade Correlation Summary
| Measurement | Immigrants from North Macedonia | Trinidadian and Tobagonian |
| Minimum | 89.6% | 86.0% |
| Maximum | 100.0% | 100.0% |
| Range | 10.4% | 14.0% |
| Mean | 95.9% | 93.7% |
| Median | 95.6% | 93.5% |
| Interquartile 25% (IQ1) | 94.6% | 92.0% |
| Interquartile 75% (IQ3) | 97.3% | 95.0% |
| Interquartile Range (IQR) | 2.6% | 3.1% |
| Standard Deviation (Sample) | 2.2% | 3.3% |
| Standard Deviation (Population) | 2.1% | 3.3% |
Similar Demographics by 10th Grade
Demographics Similar to Immigrants from North Macedonia by 10th Grade
In terms of 10th grade, the demographic groups most similar to Immigrants from North Macedonia are Immigrants from Norway (94.5%, a difference of 0.0%), Immigrants from Serbia (94.5%, a difference of 0.010%), Immigrants from Croatia (94.5%, a difference of 0.010%), Burmese (94.5%, a difference of 0.010%), and Immigrants from Europe (94.5%, a difference of 0.020%).
| Demographics | Rating | Rank | 10th Grade |
| Syrians | 97.7 /100 | #101 | Exceptional 94.5% |
| Cambodians | 97.6 /100 | #102 | Exceptional 94.5% |
| Immigrants | Europe | 97.5 /100 | #103 | Exceptional 94.5% |
| Immigrants | Romania | 97.5 /100 | #104 | Exceptional 94.5% |
| Immigrants | Turkey | 97.4 /100 | #105 | Exceptional 94.5% |
| Immigrants | Serbia | 97.4 /100 | #106 | Exceptional 94.5% |
| Immigrants | Croatia | 97.4 /100 | #107 | Exceptional 94.5% |
| Immigrants | North Macedonia | 97.2 /100 | #108 | Exceptional 94.5% |
| Immigrants | Norway | 97.2 /100 | #109 | Exceptional 94.5% |
| Burmese | 97.1 /100 | #110 | Exceptional 94.5% |
| Immigrants | Zimbabwe | 96.8 /100 | #111 | Exceptional 94.4% |
| Immigrants | Kuwait | 96.8 /100 | #112 | Exceptional 94.4% |
| Palestinians | 96.5 /100 | #113 | Exceptional 94.4% |
| German Russians | 96.3 /100 | #114 | Exceptional 94.4% |
| Delaware | 96.3 /100 | #115 | Exceptional 94.4% |
Demographics Similar to Trinidadians and Tobagonians by 10th Grade
In terms of 10th grade, the demographic groups most similar to Trinidadians and Tobagonians are Immigrants from Congo (92.4%, a difference of 0.010%), West Indian (92.4%, a difference of 0.010%), Immigrants from Western Africa (92.5%, a difference of 0.070%), Immigrants from Eritrea (92.5%, a difference of 0.080%), and Immigrants from Colombia (92.5%, a difference of 0.090%).
| Demographics | Rating | Rank | 10th Grade |
| Immigrants | Philippines | 0.4 /100 | #266 | Tragic 92.6% |
| Taiwanese | 0.3 /100 | #267 | Tragic 92.5% |
| Immigrants | Ghana | 0.3 /100 | #268 | Tragic 92.5% |
| Immigrants | Colombia | 0.3 /100 | #269 | Tragic 92.5% |
| Immigrants | Uruguay | 0.3 /100 | #270 | Tragic 92.5% |
| Immigrants | Eritrea | 0.3 /100 | #271 | Tragic 92.5% |
| Immigrants | Western Africa | 0.3 /100 | #272 | Tragic 92.5% |
| Trinidadians and Tobagonians | 0.2 /100 | #273 | Tragic 92.4% |
| Immigrants | Congo | 0.2 /100 | #274 | Tragic 92.4% |
| West Indians | 0.2 /100 | #275 | Tragic 92.4% |
| Immigrants | Trinidad and Tobago | 0.1 /100 | #276 | Tragic 92.3% |
| Navajo | 0.1 /100 | #277 | Tragic 92.3% |
| Barbadians | 0.1 /100 | #278 | Tragic 92.2% |
| Natives/Alaskans | 0.1 /100 | #279 | Tragic 92.2% |
| Malaysians | 0.1 /100 | #280 | Tragic 92.2% |