Immigrants from Nigeria vs Marshallese 9th Grade
COMPARE
Immigrants from Nigeria
Marshallese
9th Grade
9th Grade Comparison
Immigrants from Nigeria
Marshallese
94.0%
9TH GRADE
0.6/ 100
METRIC RATING
255th/ 347
METRIC RANK
94.7%
9TH GRADE
27.9/ 100
METRIC RATING
195th/ 347
METRIC RANK
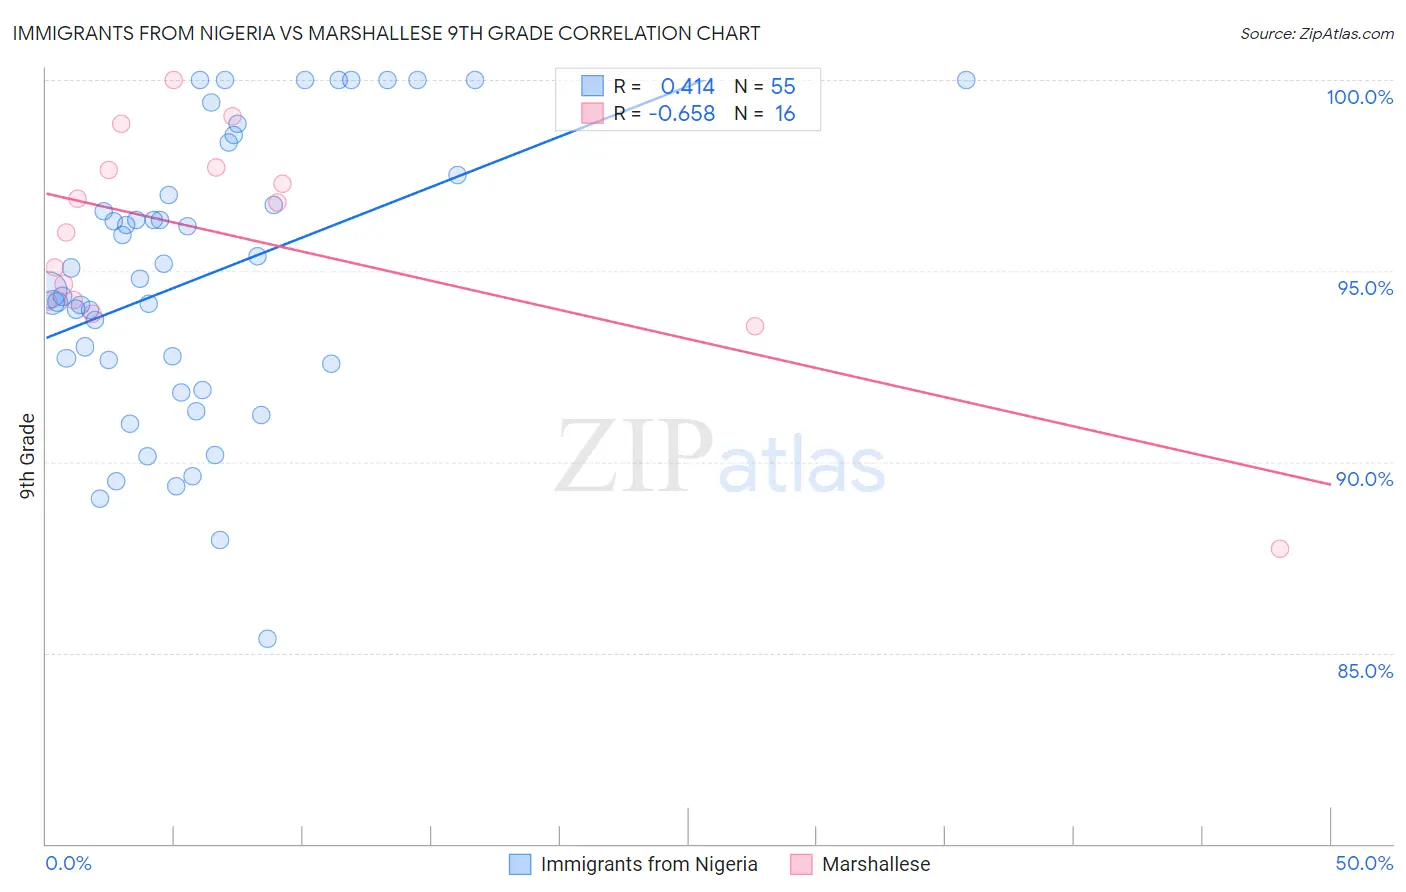
Immigrants from Nigeria vs Marshallese 9th Grade Correlation Chart
The statistical analysis conducted on geographies consisting of 283,441,873 people shows a moderate positive correlation between the proportion of Immigrants from Nigeria and percentage of population with at least 9th grade education in the United States with a correlation coefficient (R) of 0.414 and weighted average of 94.0%. Similarly, the statistical analysis conducted on geographies consisting of 14,761,315 people shows a significant negative correlation between the proportion of Marshallese and percentage of population with at least 9th grade education in the United States with a correlation coefficient (R) of -0.658 and weighted average of 94.7%, a difference of 0.78%.
9th Grade Correlation Summary
| Measurement | Immigrants from Nigeria | Marshallese |
| Minimum | 85.4% | 87.7% |
| Maximum | 100.0% | 100.0% |
| Range | 14.6% | 12.3% |
| Mean | 94.8% | 95.8% |
| Median | 94.8% | 96.4% |
| Interquartile 25% (IQ1) | 92.6% | 94.2% |
| Interquartile 75% (IQ3) | 97.5% | 97.7% |
| Interquartile Range (IQR) | 5.0% | 3.5% |
| Standard Deviation (Sample) | 3.7% | 2.9% |
| Standard Deviation (Population) | 3.6% | 2.8% |
Similar Demographics by 9th Grade
Demographics Similar to Immigrants from Nigeria by 9th Grade
In terms of 9th grade, the demographic groups most similar to Immigrants from Nigeria are Immigrants from Afghanistan (94.0%, a difference of 0.010%), Immigrants from Costa Rica (94.0%, a difference of 0.030%), Immigrants from Thailand (93.9%, a difference of 0.030%), Ghanaian (93.9%, a difference of 0.030%), and U.S. Virgin Islander (94.0%, a difference of 0.050%).
| Demographics | Rating | Rank | 9th Grade |
| Immigrants | Somalia | 1.4 /100 | #248 | Tragic 94.1% |
| Uruguayans | 1.3 /100 | #249 | Tragic 94.1% |
| Immigrants | Hong Kong | 1.3 /100 | #250 | Tragic 94.1% |
| Jamaicans | 1.0 /100 | #251 | Tragic 94.1% |
| Immigrants | Senegal | 0.9 /100 | #252 | Tragic 94.1% |
| Colombians | 0.8 /100 | #253 | Tragic 94.0% |
| U.S. Virgin Islanders | 0.7 /100 | #254 | Tragic 94.0% |
| Immigrants | Nigeria | 0.6 /100 | #255 | Tragic 94.0% |
| Immigrants | Afghanistan | 0.5 /100 | #256 | Tragic 94.0% |
| Immigrants | Costa Rica | 0.5 /100 | #257 | Tragic 94.0% |
| Immigrants | Thailand | 0.5 /100 | #258 | Tragic 93.9% |
| Ghanaians | 0.5 /100 | #259 | Tragic 93.9% |
| Pima | 0.4 /100 | #260 | Tragic 93.9% |
| South Americans | 0.4 /100 | #261 | Tragic 93.9% |
| Immigrants | Jamaica | 0.4 /100 | #262 | Tragic 93.9% |
Demographics Similar to Marshallese by 9th Grade
In terms of 9th grade, the demographic groups most similar to Marshallese are Panamanian (94.7%, a difference of 0.010%), Immigrants from Lebanon (94.7%, a difference of 0.010%), Immigrants from Northern Africa (94.7%, a difference of 0.020%), Paraguayan (94.7%, a difference of 0.020%), and Immigrants from Micronesia (94.7%, a difference of 0.030%).
| Demographics | Rating | Rank | 9th Grade |
| Immigrants | Albania | 34.5 /100 | #188 | Fair 94.8% |
| Immigrants | Argentina | 34.4 /100 | #189 | Fair 94.8% |
| Sudanese | 32.7 /100 | #190 | Fair 94.7% |
| Assyrians/Chaldeans/Syriacs | 32.0 /100 | #191 | Fair 94.7% |
| Immigrants | Northern Africa | 30.7 /100 | #192 | Fair 94.7% |
| Paraguayans | 30.1 /100 | #193 | Fair 94.7% |
| Panamanians | 29.0 /100 | #194 | Fair 94.7% |
| Marshallese | 27.9 /100 | #195 | Fair 94.7% |
| Immigrants | Lebanon | 27.2 /100 | #196 | Fair 94.7% |
| Immigrants | Micronesia | 24.7 /100 | #197 | Fair 94.7% |
| Hawaiians | 22.7 /100 | #198 | Fair 94.7% |
| Laotians | 21.0 /100 | #199 | Fair 94.6% |
| Immigrants | Zaire | 20.6 /100 | #200 | Fair 94.6% |
| Blacks/African Americans | 20.5 /100 | #201 | Fair 94.6% |
| Immigrants | Eastern Asia | 19.8 /100 | #202 | Poor 94.6% |