Immigrants from Nicaragua vs Immigrants from Guatemala 6th Grade
COMPARE
Immigrants from Nicaragua
Immigrants from Guatemala
6th Grade
6th Grade Comparison
Immigrants from Nicaragua
Immigrants from Guatemala
95.1%
6TH GRADE
0.0/ 100
METRIC RATING
325th/ 347
METRIC RANK
93.9%
6TH GRADE
0.0/ 100
METRIC RATING
344th/ 347
METRIC RANK
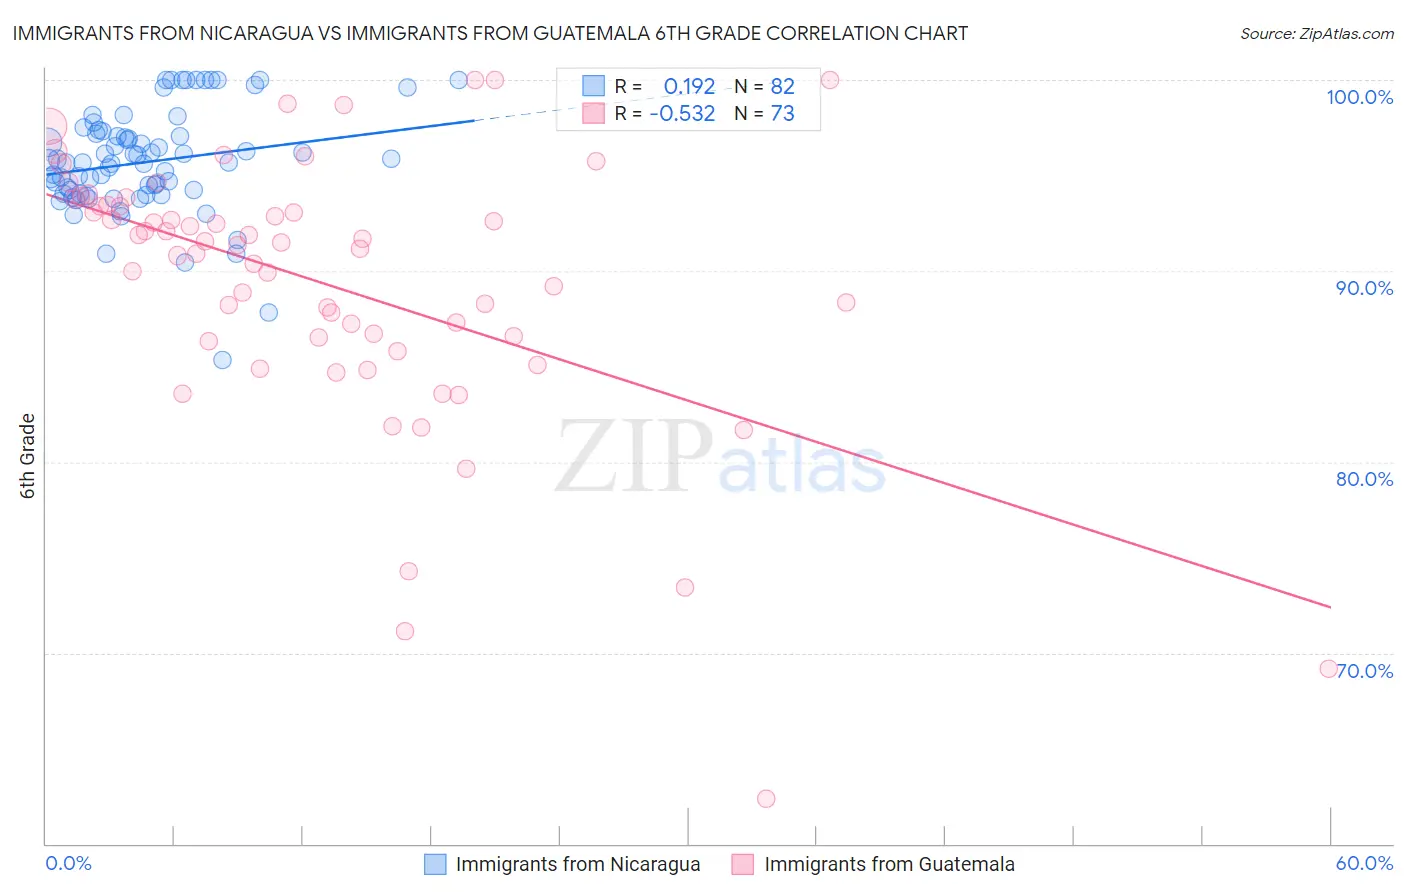
Immigrants from Nicaragua vs Immigrants from Guatemala 6th Grade Correlation Chart
The statistical analysis conducted on geographies consisting of 236,341,411 people shows a poor positive correlation between the proportion of Immigrants from Nicaragua and percentage of population with at least 6th grade education in the United States with a correlation coefficient (R) of 0.192 and weighted average of 95.1%. Similarly, the statistical analysis conducted on geographies consisting of 377,285,993 people shows a substantial negative correlation between the proportion of Immigrants from Guatemala and percentage of population with at least 6th grade education in the United States with a correlation coefficient (R) of -0.532 and weighted average of 93.9%, a difference of 1.2%.
6th Grade Correlation Summary
| Measurement | Immigrants from Nicaragua | Immigrants from Guatemala |
| Minimum | 85.3% | 62.4% |
| Maximum | 100.0% | 100.0% |
| Range | 14.7% | 37.6% |
| Mean | 95.7% | 89.3% |
| Median | 95.7% | 91.4% |
| Interquartile 25% (IQ1) | 94.0% | 86.4% |
| Interquartile 75% (IQ3) | 97.2% | 93.4% |
| Interquartile Range (IQR) | 3.1% | 7.0% |
| Standard Deviation (Sample) | 2.8% | 7.1% |
| Standard Deviation (Population) | 2.8% | 7.0% |
Demographics Similar to Immigrants from Nicaragua and Immigrants from Guatemala by 6th Grade
In terms of 6th grade, the demographic groups most similar to Immigrants from Nicaragua are Cape Verdean (95.1%, a difference of 0.030%), Hispanic or Latino (95.0%, a difference of 0.070%), Mexican American Indian (95.0%, a difference of 0.10%), Honduran (95.0%, a difference of 0.10%), and Dominican (94.9%, a difference of 0.17%). Similarly, the demographic groups most similar to Immigrants from Guatemala are Immigrants from Mexico (93.9%, a difference of 0.0%), Immigrants from Central America (94.0%, a difference of 0.060%), Immigrants from Yemen (94.1%, a difference of 0.17%), Guatemalan (94.2%, a difference of 0.28%), and Yakama (94.3%, a difference of 0.39%).
| Demographics | Rating | Rank | 6th Grade |
| Cape Verdeans | 0.0 /100 | #324 | Tragic 95.1% |
| Immigrants | Nicaragua | 0.0 /100 | #325 | Tragic 95.1% |
| Hispanics or Latinos | 0.0 /100 | #326 | Tragic 95.0% |
| Mexican American Indians | 0.0 /100 | #327 | Tragic 95.0% |
| Hondurans | 0.0 /100 | #328 | Tragic 95.0% |
| Dominicans | 0.0 /100 | #329 | Tragic 94.9% |
| Nepalese | 0.0 /100 | #330 | Tragic 94.9% |
| Immigrants | Armenia | 0.0 /100 | #331 | Tragic 94.9% |
| Immigrants | Honduras | 0.0 /100 | #332 | Tragic 94.8% |
| Immigrants | Latin America | 0.0 /100 | #333 | Tragic 94.7% |
| Immigrants | Azores | 0.0 /100 | #334 | Tragic 94.7% |
| Mexicans | 0.0 /100 | #335 | Tragic 94.6% |
| Immigrants | Dominican Republic | 0.0 /100 | #336 | Tragic 94.6% |
| Central Americans | 0.0 /100 | #337 | Tragic 94.5% |
| Immigrants | Cabo Verde | 0.0 /100 | #338 | Tragic 94.4% |
| Yakama | 0.0 /100 | #339 | Tragic 94.3% |
| Guatemalans | 0.0 /100 | #340 | Tragic 94.2% |
| Immigrants | Yemen | 0.0 /100 | #341 | Tragic 94.1% |
| Immigrants | Central America | 0.0 /100 | #342 | Tragic 94.0% |
| Immigrants | Mexico | 0.0 /100 | #343 | Tragic 93.9% |
| Immigrants | Guatemala | 0.0 /100 | #344 | Tragic 93.9% |