Immigrants from Netherlands vs Immigrants from Fiji 4th Grade

COMPARE

Immigrants from Netherlands
Race
Ancestry
AfghanAfricanAlaska NativeAlaskan AthabascanAlbanianAleutAlsatianAmericanApacheArabArapahoArgentineanArmenianAssyrian/Chaldean/SyriacAustralianAustrianBahamianBangladeshiBarbadianBasqueBelgianBelizeanBermudanBhutaneseBlackfeetBolivianBrazilianBritishBritish West IndianBulgarianBurmeseCajunCambodianCanadianCape VerdeanCarpatho RusynCelticCentral AmericanCentral American IndianCherokeeCheyenneChickasawChileanChineseChippewaChoctawColombianColvilleComancheCosta RicanCreeCreekCroatianCrowCubanCypriotCzechCzechoslovakianDanishDelawareDominicanDutchDutch West IndianEastern EuropeanEcuadorianEgyptianEnglishEstonianEthiopianEuropeanFijianFilipinoFinnishFrenchFrench American IndianFrench CanadianGermanGerman RussianGhanaianGreekGuamanian/ChamorroGuatemalanGuyaneseHaitianHmongHonduranHopiHoumaHungarianIcelanderIndian (Asian)IndonesianInupiatIranianIraqiIrishIroquoisIsraeliItalianJamaicanJapaneseJordanianKenyanKiowaKoreanLaotianLatvianLebaneseLiberianLithuanianLumbeeLuxembourgerMacedonianMalaysianMalteseMarshalleseMenomineeMexicanMexican American IndianMongolianMoroccanNative HawaiianNavajoNepaleseNew ZealanderNicaraguanNigerianNorthern EuropeanNorwegianOkinawanOsageOttawaPaiutePakistaniPalestinianPanamanianParaguayanPennsylvania GermanPeruvianPimaPolishPortuguesePotawatomiPuebloPuerto RicanPuget Sound SalishRomanianRussianSalvadoranSamoanScandinavianScotch-IrishScottishSeminoleSenegaleseSerbianShoshoneSierra LeoneanSiouxSlavicSlovakSloveneSomaliSouth AfricanSouth AmericanSouth American IndianSoviet UnionSpaniardSpanishSpanish AmericanSpanish American IndianSri LankanSubsaharan AfricanSudaneseSwedishSwissSyrianTaiwaneseThaiTlingit-HaidaTohono O'OdhamTonganTrinidadian and TobagonianTsimshianTurkishU.S. Virgin IslanderUgandanUkrainianUruguayanUteVenezuelanVietnameseWelshWest IndianYakamaYaquiYugoslavianYumanYup'ikZimbabwean
Immigration
NonimmigrantsImmigrantsAfghanistanAfricaAlbaniaArgentinaArmeniaAsiaAustraliaAustriaBahamasBangladeshBarbadosBelarusBelgiumBelizeBoliviaBosnia and HerzegovinaBrazilBulgariaBurma/MyanmarCabo VerdeCambodiaCameroonCanadaCaribbeanCentral AmericaChileChinaColombiaCongoCosta RicaCroatiaCubaCzechoslovakiaDenmarkDominicaDominican RepublicEastern AfricaEastern AsiaEastern EuropeEcuadorEgyptEl SalvadorEnglandEritreaEthiopiaEuropeFranceGermanyGhanaGreeceGrenadaGuatemalaGuyanaHaitiHondurasHong KongHungaryIndiaIndonesiaIranIraqIrelandIsraelItalyJamaicaJapanJordanKazakhstanKenyaKoreaKuwaitLaosLatin AmericaLatviaLebanonLiberiaLithuaniaMalaysiaMexicoMicronesiaMiddle AfricaMoldovaMoroccoNepalNetherlandsNicaraguaNigeriaNorth AmericaNorth MacedoniaNorthern AfricaNorthern EuropeNorwayOceaniaPakistanPanamaPeruPhilippinesPolandPortugalRomaniaRussiaSaudi ArabiaScotlandSenegalSerbiaSierra LeoneSingaporeSomaliaSouth AfricaSouth AmericaSouth Central AsiaSouth Eastern AsiaSouthern EuropeSpainSri LankaSt. Vincent and the GrenadinesSudanSwedenSwitzerlandSyriaTaiwanThailandTrinidad and TobagoTurkeyUgandaUkraineUruguayUzbekistanVenezuelaVietnamWest IndiesWestern AfricaWestern AsiaWestern EuropeYemenZaireZimbabweAzores
Immigrants from Fiji
Race
Ancestry
AfghanAfricanAlaska NativeAlaskan AthabascanAlbanianAleutAlsatianAmericanApacheArabArapahoArgentineanArmenianAssyrian/Chaldean/SyriacAustralianAustrianBahamianBangladeshiBarbadianBasqueBelgianBelizeanBermudanBhutaneseBlackfeetBolivianBrazilianBritishBritish West IndianBulgarianBurmeseCajunCambodianCanadianCape VerdeanCarpatho RusynCelticCentral AmericanCentral American IndianCherokeeCheyenneChickasawChileanChineseChippewaChoctawColombianColvilleComancheCosta RicanCreeCreekCroatianCrowCubanCypriotCzechCzechoslovakianDanishDelawareDominicanDutchDutch West IndianEastern EuropeanEcuadorianEgyptianEnglishEstonianEthiopianEuropeanFijianFilipinoFinnishFrenchFrench American IndianFrench CanadianGermanGerman RussianGhanaianGreekGuamanian/ChamorroGuatemalanGuyaneseHaitianHmongHonduranHopiHoumaHungarianIcelanderIndian (Asian)IndonesianInupiatIranianIraqiIrishIroquoisIsraeliItalianJamaicanJapaneseJordanianKenyanKiowaKoreanLaotianLatvianLebaneseLiberianLithuanianLumbeeLuxembourgerMacedonianMalaysianMalteseMarshalleseMenomineeMexicanMexican American IndianMongolianMoroccanNative HawaiianNavajoNepaleseNew ZealanderNicaraguanNigerianNorthern EuropeanNorwegianOkinawanOsageOttawaPaiutePakistaniPalestinianPanamanianParaguayanPennsylvania GermanPeruvianPimaPolishPortuguesePotawatomiPuebloPuerto RicanPuget Sound SalishRomanianRussianSalvadoranSamoanScandinavianScotch-IrishScottishSeminoleSenegaleseSerbianShoshoneSierra LeoneanSiouxSlavicSlovakSloveneSomaliSouth AfricanSouth AmericanSouth American IndianSoviet UnionSpaniardSpanishSpanish AmericanSpanish American IndianSri LankanSubsaharan AfricanSudaneseSwedishSwissSyrianTaiwaneseThaiTlingit-HaidaTohono O'OdhamTonganTrinidadian and TobagonianTsimshianTurkishU.S. Virgin IslanderUgandanUkrainianUruguayanUteVenezuelanVietnameseWelshWest IndianYakamaYaquiYugoslavianYumanYup'ikZimbabwean
Immigration
NonimmigrantsImmigrantsAfghanistanAfricaAlbaniaArgentinaArmeniaAsiaAustraliaAustriaBahamasBangladeshBarbadosBelarusBelgiumBelizeBoliviaBosnia and HerzegovinaBrazilBulgariaBurma/MyanmarCabo VerdeCambodiaCameroonCanadaCaribbeanCentral AmericaChileChinaColombiaCongoCosta RicaCroatiaCubaCzechoslovakiaDenmarkDominicaDominican RepublicEastern AfricaEastern AsiaEastern EuropeEcuadorEgyptEl SalvadorEnglandEritreaEthiopiaEuropeFijiFranceGermanyGhanaGreeceGrenadaGuatemalaGuyanaHaitiHondurasHong KongHungaryIndiaIndonesiaIranIraqIrelandIsraelItalyJamaicaJapanJordanKazakhstanKenyaKoreaKuwaitLaosLatin AmericaLatviaLebanonLiberiaLithuaniaMalaysiaMexicoMicronesiaMiddle AfricaMoldovaMoroccoNepalNicaraguaNigeriaNorth AmericaNorth MacedoniaNorthern AfricaNorthern EuropeNorwayOceaniaPakistanPanamaPeruPhilippinesPolandPortugalRomaniaRussiaSaudi ArabiaScotlandSenegalSerbiaSierra LeoneSingaporeSomaliaSouth AfricaSouth AmericaSouth Central AsiaSouth Eastern AsiaSouthern EuropeSpainSri LankaSt. Vincent and the GrenadinesSudanSwedenSwitzerlandSyriaTaiwanThailandTrinidad and TobagoTurkeyUgandaUkraineUruguayUzbekistanVenezuelaVietnamWest IndiesWestern AfricaWestern AsiaWestern EuropeYemenZaireZimbabweAzores
4th Grade
Income
Poverty
Unemployment
Labor Participation
Family Structure
Vehicle Availability
Education Level
Disability

4th Grade Comparison

Immigrants from Netherlands

Immigrants from Fiji

Exceptional
Tragic
98.0%
4TH GRADE
99.3/ 100
METRIC RATING
75th/ 347
METRIC RANK
95.8%
4TH GRADE
0.0/ 100
METRIC RATING
330th/ 347
METRIC RANK

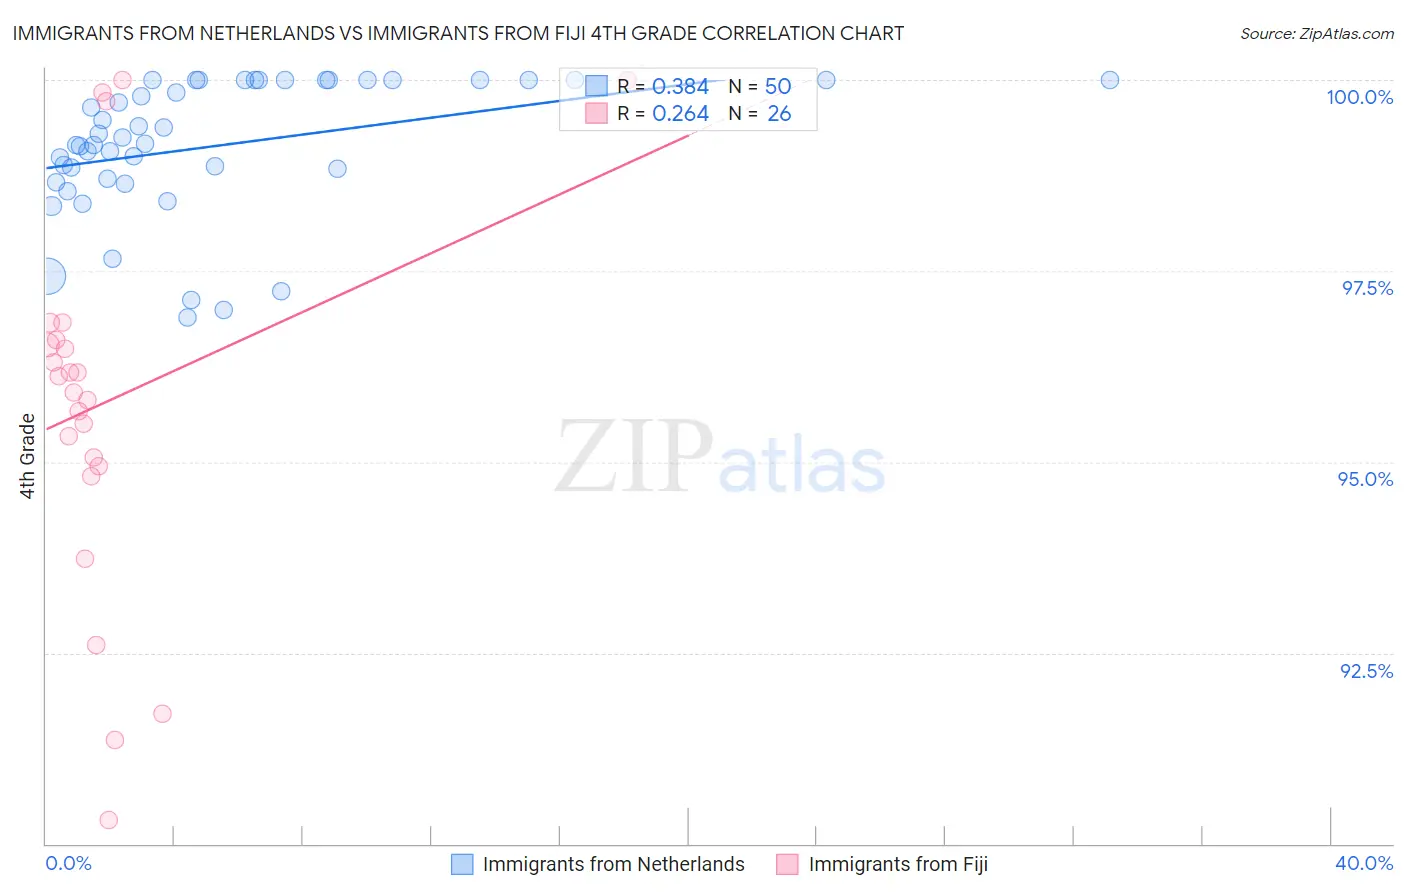
Immigrants from Netherlands vs Immigrants from Fiji 4th Grade Correlation Chart

The statistical analysis conducted on geographies consisting of 237,869,934 people shows a mild positive correlation between the proportion of Immigrants from Netherlands and percentage of population with at least 4th grade education in the United States with a correlation coefficient (R) of 0.384 and weighted average of 98.0%. Similarly, the statistical analysis conducted on geographies consisting of 93,756,204 people shows a weak positive correlation between the proportion of Immigrants from Fiji and percentage of population with at least 4th grade education in the United States with a correlation coefficient (R) of 0.264 and weighted average of 95.8%, a difference of 2.2%.
Immigrants from Netherlands vs Immigrants from Fiji 4th Grade

4th Grade Correlation Summary

MeasurementImmigrants from NetherlandsImmigrants from Fiji
Minimum96.9%90.3%
Maximum100.0%100.0%
Range3.1%9.7%
Mean99.1%95.8%
Median99.2%96.0%
Interquartile 25% (IQ1)98.7%94.9%
Interquartile 75% (IQ3)100.0%96.6%
Interquartile Range (IQR)1.3%1.7%
Standard Deviation (Sample)0.90%2.5%
Standard Deviation (Population)0.89%2.4%

Similar Demographics by 4th Grade

Demographics Similar to Immigrants from Netherlands by 4th Grade

In terms of 4th grade, the demographic groups most similar to Immigrants from Netherlands are Cherokee (98.0%, a difference of 0.0%), Immigrants from Lithuania (98.0%, a difference of 0.0%), Chickasaw (98.0%, a difference of 0.010%), Immigrants from England (98.0%, a difference of 0.010%), and Ukrainian (98.0%, a difference of 0.010%).
DemographicsRating | Rank4th Grade
Kiowa
99.6
/100
|
#68
Exceptional
98.0%
Pueblo
99.6
/100
|
#69
Exceptional
98.0%
Immigrants | Austria
99.6
/100
|
#70
Exceptional
98.0%
Lumbee
99.6
/100
|
#71
Exceptional
98.0%
Iranians
99.4
/100
|
#72
Exceptional
98.0%
Macedonians
99.4
/100
|
#73
Exceptional
98.0%
Chickasaw
99.4
/100
|
#74
Exceptional
98.0%
Immigrants | Netherlands
99.3
/100
|
#75
Exceptional
98.0%
Cherokee
99.3
/100
|
#76
Exceptional
98.0%
Immigrants | Lithuania
99.3
/100
|
#77
Exceptional
98.0%
Immigrants | England
99.3
/100
|
#78
Exceptional
98.0%
Ukrainians
99.2
/100
|
#79
Exceptional
98.0%
Osage
99.2
/100
|
#80
Exceptional
98.0%
Immigrants | India
99.1
/100
|
#81
Exceptional
98.0%
Icelanders
99.1
/100
|
#82
Exceptional
98.0%

Demographics Similar to Immigrants from Fiji by 4th Grade

In terms of 4th grade, the demographic groups most similar to Immigrants from Fiji are Immigrants from Cambodia (95.8%, a difference of 0.0%), Mexican American Indian (95.8%, a difference of 0.020%), Immigrants from Armenia (95.8%, a difference of 0.050%), Immigrants from Honduras (95.8%, a difference of 0.060%), and Immigrants from Dominican Republic (95.7%, a difference of 0.11%).
DemographicsRating | Rank4th Grade
Immigrants | Nicaragua
0.0
/100
|
#323
Tragic
96.0%
Immigrants | Belize
0.0
/100
|
#324
Tragic
96.0%
Dominicans
0.0
/100
|
#325
Tragic
96.0%
Hispanics or Latinos
0.0
/100
|
#326
Tragic
96.0%
Hondurans
0.0
/100
|
#327
Tragic
96.0%
Mexican American Indians
0.0
/100
|
#328
Tragic
95.8%
Immigrants | Cambodia
0.0
/100
|
#329
Tragic
95.8%
Immigrants | Fiji
0.0
/100
|
#330
Tragic
95.8%
Immigrants | Armenia
0.0
/100
|
#331
Tragic
95.8%
Immigrants | Honduras
0.0
/100
|
#332
Tragic
95.8%
Immigrants | Dominican Republic
0.0
/100
|
#333
Tragic
95.7%
Immigrants | Cabo Verde
0.0
/100
|
#334
Tragic
95.7%
Immigrants | Latin America
0.0
/100
|
#335
Tragic
95.7%
Mexicans
0.0
/100
|
#336
Tragic
95.6%
Central Americans
0.0
/100
|
#337
Tragic
95.5%