Immigrants from Netherlands vs Immigrants from El Salvador 2nd Grade
COMPARE
Immigrants from Netherlands
Immigrants from El Salvador
2nd Grade
2nd Grade Comparison
Immigrants from Netherlands
Immigrants from El Salvador
98.3%
2ND GRADE
99.4/ 100
METRIC RATING
74th/ 347
METRIC RANK
95.9%
2ND GRADE
0.0/ 100
METRIC RATING
345th/ 347
METRIC RANK
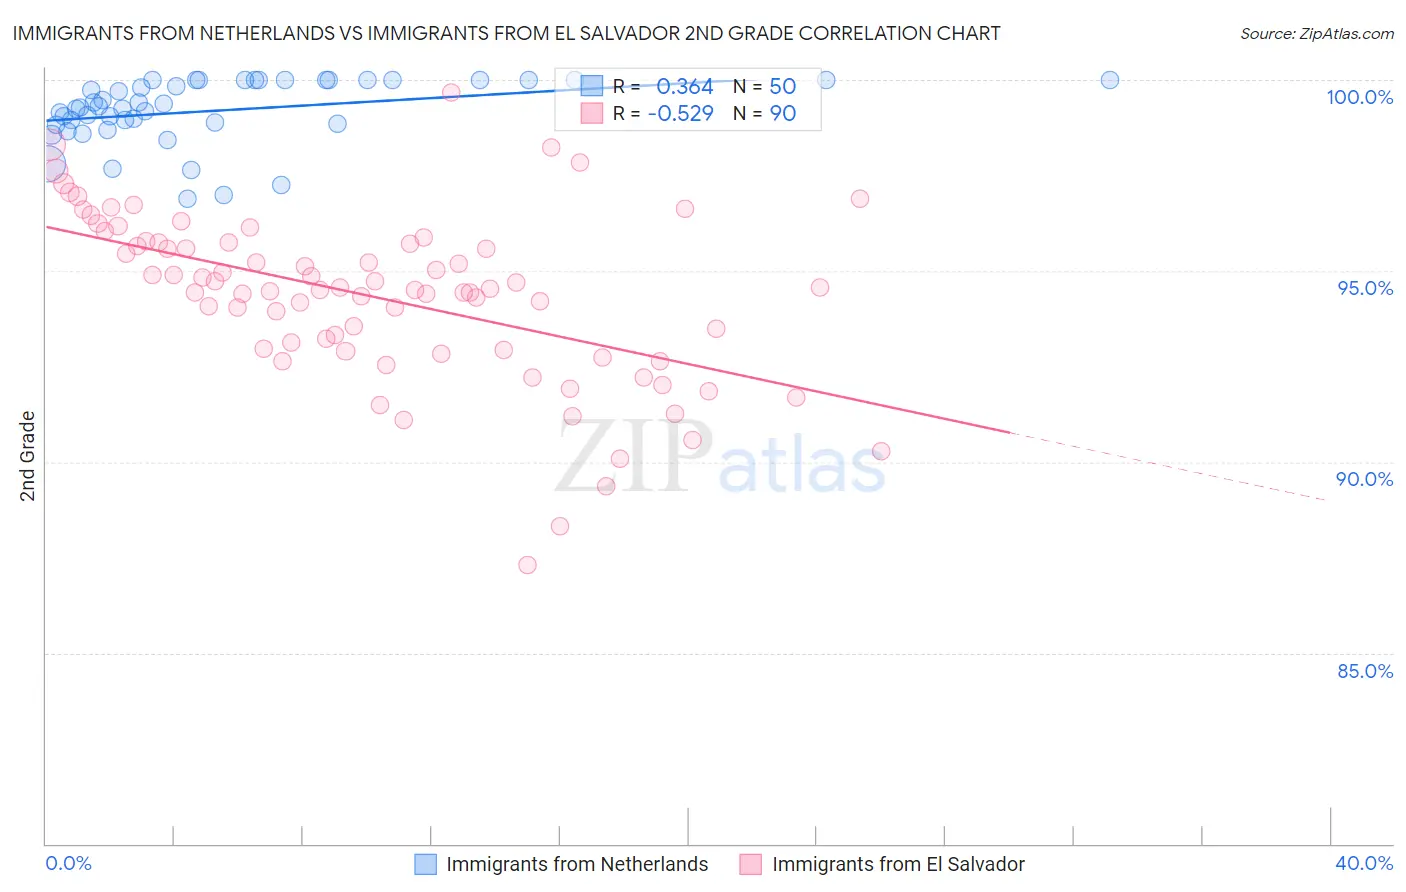
Immigrants from Netherlands vs Immigrants from El Salvador 2nd Grade Correlation Chart
The statistical analysis conducted on geographies consisting of 237,869,934 people shows a mild positive correlation between the proportion of Immigrants from Netherlands and percentage of population with at least 2nd grade education in the United States with a correlation coefficient (R) of 0.364 and weighted average of 98.3%. Similarly, the statistical analysis conducted on geographies consisting of 357,852,938 people shows a substantial negative correlation between the proportion of Immigrants from El Salvador and percentage of population with at least 2nd grade education in the United States with a correlation coefficient (R) of -0.529 and weighted average of 95.9%, a difference of 2.5%.
2nd Grade Correlation Summary
| Measurement | Immigrants from Netherlands | Immigrants from El Salvador |
| Minimum | 96.9% | 87.3% |
| Maximum | 100.0% | 99.7% |
| Range | 3.1% | 12.4% |
| Mean | 99.2% | 94.3% |
| Median | 99.3% | 94.5% |
| Interquartile 25% (IQ1) | 98.8% | 92.9% |
| Interquartile 75% (IQ3) | 100.0% | 95.7% |
| Interquartile Range (IQR) | 1.2% | 2.8% |
| Standard Deviation (Sample) | 0.85% | 2.2% |
| Standard Deviation (Population) | 0.84% | 2.2% |
Similar Demographics by 2nd Grade
Demographics Similar to Immigrants from Netherlands by 2nd Grade
In terms of 2nd grade, the demographic groups most similar to Immigrants from Netherlands are Shoshone (98.3%, a difference of 0.010%), Cherokee (98.3%, a difference of 0.010%), Immigrants from England (98.3%, a difference of 0.010%), Cheyenne (98.3%, a difference of 0.020%), and Cajun (98.3%, a difference of 0.020%).
| Demographics | Rating | Rank | 2nd Grade |
| Immigrants | Northern Europe | 99.7 /100 | #67 | Exceptional 98.3% |
| Russians | 99.7 /100 | #68 | Exceptional 98.3% |
| Immigrants | Austria | 99.6 /100 | #69 | Exceptional 98.3% |
| Serbians | 99.6 /100 | #70 | Exceptional 98.3% |
| Chickasaw | 99.6 /100 | #71 | Exceptional 98.3% |
| Cheyenne | 99.6 /100 | #72 | Exceptional 98.3% |
| Cajuns | 99.5 /100 | #73 | Exceptional 98.3% |
| Immigrants | Netherlands | 99.4 /100 | #74 | Exceptional 98.3% |
| Shoshone | 99.4 /100 | #75 | Exceptional 98.3% |
| Cherokee | 99.4 /100 | #76 | Exceptional 98.3% |
| Immigrants | England | 99.4 /100 | #77 | Exceptional 98.3% |
| Immigrants | Lithuania | 99.3 /100 | #78 | Exceptional 98.2% |
| Immigrants | Belgium | 99.3 /100 | #79 | Exceptional 98.2% |
| Osage | 99.2 /100 | #80 | Exceptional 98.2% |
| Icelanders | 99.2 /100 | #81 | Exceptional 98.2% |
Demographics Similar to Immigrants from El Salvador by 2nd Grade
In terms of 2nd grade, the demographic groups most similar to Immigrants from El Salvador are Immigrants from Yemen (95.7%, a difference of 0.14%), Salvadoran (96.0%, a difference of 0.16%), Nepalese (96.1%, a difference of 0.20%), Immigrants from Mexico (96.1%, a difference of 0.29%), and Immigrants from Central America (96.2%, a difference of 0.31%).
| Demographics | Rating | Rank | 2nd Grade |
| Immigrants | Dominican Republic | 0.0 /100 | #333 | Tragic 96.4% |
| Central Americans | 0.0 /100 | #334 | Tragic 96.4% |
| Yakama | 0.0 /100 | #335 | Tragic 96.4% |
| Immigrants | Fiji | 0.0 /100 | #336 | Tragic 96.4% |
| Immigrants | Cambodia | 0.0 /100 | #337 | Tragic 96.4% |
| Immigrants | Cabo Verde | 0.0 /100 | #338 | Tragic 96.3% |
| Guatemalans | 0.0 /100 | #339 | Tragic 96.3% |
| Immigrants | Guatemala | 0.0 /100 | #340 | Tragic 96.2% |
| Immigrants | Central America | 0.0 /100 | #341 | Tragic 96.2% |
| Immigrants | Mexico | 0.0 /100 | #342 | Tragic 96.1% |
| Nepalese | 0.0 /100 | #343 | Tragic 96.1% |
| Salvadorans | 0.0 /100 | #344 | Tragic 96.0% |
| Immigrants | El Salvador | 0.0 /100 | #345 | Tragic 95.9% |
| Immigrants | Yemen | 0.0 /100 | #346 | Tragic 95.7% |
| Spanish American Indians | 0.0 /100 | #347 | Tragic 95.6% |