Immigrants from Netherlands vs German Russian 10th Grade

COMPARE

Immigrants from Netherlands
Race
Ancestry
AfghanAfricanAlaska NativeAlaskan AthabascanAlbanianAleutAlsatianAmericanApacheArabArapahoArgentineanArmenianAssyrian/Chaldean/SyriacAustralianAustrianBahamianBangladeshiBarbadianBasqueBelgianBelizeanBermudanBhutaneseBlackfeetBolivianBrazilianBritishBritish West IndianBulgarianBurmeseCajunCambodianCanadianCape VerdeanCarpatho RusynCelticCentral AmericanCentral American IndianCherokeeCheyenneChickasawChileanChineseChippewaChoctawColombianColvilleComancheCosta RicanCreeCreekCroatianCrowCubanCypriotCzechCzechoslovakianDanishDelawareDominicanDutchDutch West IndianEastern EuropeanEcuadorianEgyptianEnglishEstonianEthiopianEuropeanFijianFilipinoFinnishFrenchFrench American IndianFrench CanadianGermanGhanaianGreekGuamanian/ChamorroGuatemalanGuyaneseHaitianHmongHonduranHopiHoumaHungarianIcelanderIndian (Asian)IndonesianInupiatIranianIraqiIrishIroquoisIsraeliItalianJamaicanJapaneseJordanianKenyanKiowaKoreanLaotianLatvianLebaneseLiberianLithuanianLumbeeLuxembourgerMacedonianMalaysianMalteseMarshalleseMenomineeMexicanMexican American IndianMongolianMoroccanNative HawaiianNavajoNepaleseNew ZealanderNicaraguanNigerianNorthern EuropeanNorwegianOkinawanOsageOttawaPaiutePakistaniPalestinianPanamanianParaguayanPennsylvania GermanPeruvianPimaPolishPortuguesePotawatomiPuebloPuerto RicanPuget Sound SalishRomanianRussianSalvadoranSamoanScandinavianScotch-IrishScottishSeminoleSenegaleseSerbianShoshoneSierra LeoneanSiouxSlavicSlovakSloveneSomaliSouth AfricanSouth AmericanSouth American IndianSoviet UnionSpaniardSpanishSpanish AmericanSpanish American IndianSri LankanSubsaharan AfricanSudaneseSwedishSwissSyrianTaiwaneseThaiTlingit-HaidaTohono O'OdhamTonganTrinidadian and TobagonianTsimshianTurkishU.S. Virgin IslanderUgandanUkrainianUruguayanUteVenezuelanVietnameseWelshWest IndianYakamaYaquiYugoslavianYumanYup'ikZimbabwean
Immigration
NonimmigrantsImmigrantsAfghanistanAfricaAlbaniaArgentinaArmeniaAsiaAustraliaAustriaBahamasBangladeshBarbadosBelarusBelgiumBelizeBoliviaBosnia and HerzegovinaBrazilBulgariaBurma/MyanmarCabo VerdeCambodiaCameroonCanadaCaribbeanCentral AmericaChileChinaColombiaCongoCosta RicaCroatiaCubaCzechoslovakiaDenmarkDominicaDominican RepublicEastern AfricaEastern AsiaEastern EuropeEcuadorEgyptEl SalvadorEnglandEritreaEthiopiaEuropeFijiFranceGermanyGhanaGreeceGrenadaGuatemalaGuyanaHaitiHondurasHong KongHungaryIndiaIndonesiaIranIraqIrelandIsraelItalyJamaicaJapanJordanKazakhstanKenyaKoreaKuwaitLaosLatin AmericaLatviaLebanonLiberiaLithuaniaMalaysiaMexicoMicronesiaMiddle AfricaMoldovaMoroccoNepalNetherlandsNicaraguaNigeriaNorth AmericaNorth MacedoniaNorthern AfricaNorthern EuropeNorwayOceaniaPakistanPanamaPeruPhilippinesPolandPortugalRomaniaRussiaSaudi ArabiaScotlandSenegalSerbiaSierra LeoneSingaporeSomaliaSouth AfricaSouth AmericaSouth Central AsiaSouth Eastern AsiaSouthern EuropeSpainSri LankaSt. Vincent and the GrenadinesSudanSwedenSwitzerlandSyriaTaiwanThailandTrinidad and TobagoTurkeyUgandaUkraineUruguayUzbekistanVenezuelaVietnamWest IndiesWestern AfricaWestern AsiaWestern EuropeYemenZaireZimbabweAzores
German Russian
Race
Ancestry
AfghanAfricanAlaska NativeAlaskan AthabascanAlbanianAleutAlsatianAmericanApacheArabArapahoArgentineanArmenianAssyrian/Chaldean/SyriacAustralianAustrianBahamianBangladeshiBarbadianBasqueBelgianBelizeanBermudanBhutaneseBlackfeetBolivianBrazilianBritishBritish West IndianBulgarianBurmeseCajunCambodianCanadianCape VerdeanCarpatho RusynCelticCentral AmericanCentral American IndianCherokeeCheyenneChickasawChileanChineseChippewaChoctawColombianColvilleComancheCosta RicanCreeCreekCroatianCrowCubanCypriotCzechCzechoslovakianDanishDelawareDominicanDutchDutch West IndianEastern EuropeanEcuadorianEgyptianEnglishEstonianEthiopianEuropeanFijianFilipinoFinnishFrenchFrench American IndianFrench CanadianGermanGerman RussianGhanaianGreekGuamanian/ChamorroGuatemalanGuyaneseHaitianHmongHonduranHopiHoumaHungarianIcelanderIndian (Asian)IndonesianInupiatIranianIraqiIrishIroquoisIsraeliItalianJamaicanJapaneseJordanianKenyanKiowaKoreanLaotianLatvianLebaneseLiberianLithuanianLumbeeLuxembourgerMacedonianMalaysianMalteseMarshalleseMenomineeMexicanMexican American IndianMongolianMoroccanNative HawaiianNavajoNepaleseNew ZealanderNicaraguanNigerianNorthern EuropeanNorwegianOkinawanOsageOttawaPaiutePakistaniPalestinianPanamanianParaguayanPennsylvania GermanPeruvianPimaPolishPortuguesePotawatomiPuebloPuerto RicanPuget Sound SalishRomanianRussianSalvadoranSamoanScandinavianScotch-IrishScottishSeminoleSenegaleseSerbianShoshoneSierra LeoneanSiouxSlavicSlovakSloveneSomaliSouth AfricanSouth AmericanSouth American IndianSoviet UnionSpaniardSpanishSpanish AmericanSpanish American IndianSri LankanSubsaharan AfricanSudaneseSwedishSwissSyrianTaiwaneseThaiTlingit-HaidaTohono O'OdhamTonganTrinidadian and TobagonianTsimshianTurkishU.S. Virgin IslanderUgandanUkrainianUruguayanUteVenezuelanVietnameseWelshWest IndianYakamaYaquiYugoslavianYumanYup'ikZimbabwean
Immigration
NonimmigrantsImmigrantsAfghanistanAfricaAlbaniaArgentinaArmeniaAsiaAustraliaAustriaBahamasBangladeshBarbadosBelarusBelgiumBelizeBoliviaBosnia and HerzegovinaBrazilBulgariaBurma/MyanmarCabo VerdeCambodiaCameroonCanadaCaribbeanCentral AmericaChileChinaColombiaCongoCosta RicaCroatiaCubaCzechoslovakiaDenmarkDominicaDominican RepublicEastern AfricaEastern AsiaEastern EuropeEcuadorEgyptEl SalvadorEnglandEritreaEthiopiaEuropeFijiFranceGermanyGhanaGreeceGrenadaGuatemalaGuyanaHaitiHondurasHong KongHungaryIndiaIndonesiaIranIraqIrelandIsraelItalyJamaicaJapanJordanKazakhstanKenyaKoreaKuwaitLaosLatin AmericaLatviaLebanonLiberiaLithuaniaMalaysiaMexicoMicronesiaMiddle AfricaMoldovaMoroccoNepalNicaraguaNigeriaNorth AmericaNorth MacedoniaNorthern AfricaNorthern EuropeNorwayOceaniaPakistanPanamaPeruPhilippinesPolandPortugalRomaniaRussiaSaudi ArabiaScotlandSenegalSerbiaSierra LeoneSingaporeSomaliaSouth AfricaSouth AmericaSouth Central AsiaSouth Eastern AsiaSouthern EuropeSpainSri LankaSt. Vincent and the GrenadinesSudanSwedenSwitzerlandSyriaTaiwanThailandTrinidad and TobagoTurkeyUgandaUkraineUruguayUzbekistanVenezuelaVietnamWest IndiesWestern AfricaWestern AsiaWestern EuropeYemenZaireZimbabweAzores
10th Grade
Income
Poverty
Unemployment
Labor Participation
Family Structure
Vehicle Availability
Education Level
Disability

10th Grade Comparison

Immigrants from Netherlands

German Russians

Exceptional
Exceptional
94.9%
10TH GRADE
99.7/ 100
METRIC RATING
67th/ 347
METRIC RANK
94.4%
10TH GRADE
96.3/ 100
METRIC RATING
114th/ 347
METRIC RANK

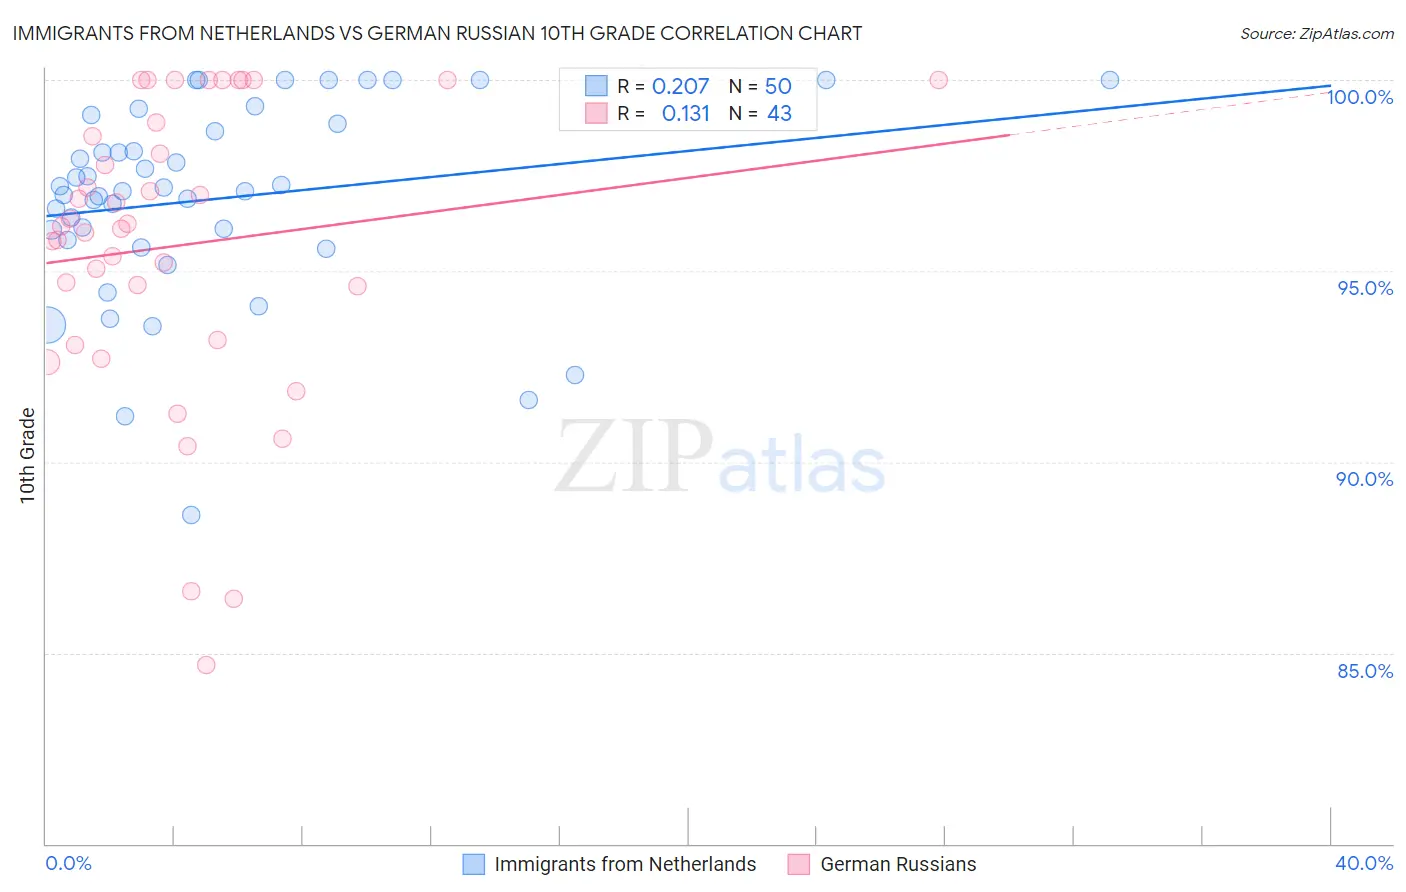
Immigrants from Netherlands vs German Russian 10th Grade Correlation Chart

The statistical analysis conducted on geographies consisting of 237,869,934 people shows a weak positive correlation between the proportion of Immigrants from Netherlands and percentage of population with at least 10th grade education in the United States with a correlation coefficient (R) of 0.207 and weighted average of 94.9%. Similarly, the statistical analysis conducted on geographies consisting of 96,461,984 people shows a poor positive correlation between the proportion of German Russians and percentage of population with at least 10th grade education in the United States with a correlation coefficient (R) of 0.131 and weighted average of 94.4%, a difference of 0.54%.
Immigrants from Netherlands vs German Russian 10th Grade

10th Grade Correlation Summary

MeasurementImmigrants from NetherlandsGerman Russian
Minimum88.6%84.7%
Maximum100.0%100.0%
Range11.4%15.3%
Mean96.9%95.7%
Median97.1%96.2%
Interquartile 25% (IQ1)95.8%93.2%
Interquartile 75% (IQ3)98.8%98.9%
Interquartile Range (IQR)3.0%5.7%
Standard Deviation (Sample)2.6%3.9%
Standard Deviation (Population)2.5%3.8%

Similar Demographics by 10th Grade

Demographics Similar to Immigrants from Netherlands by 10th Grade

In terms of 10th grade, the demographic groups most similar to Immigrants from Netherlands are Immigrants from Australia (94.9%, a difference of 0.0%), Immigrants from Belgium (94.9%, a difference of 0.0%), Immigrants from England (94.9%, a difference of 0.020%), Zimbabwean (94.9%, a difference of 0.030%), and Alaska Native (94.9%, a difference of 0.030%).
DemographicsRating | Rank10th Grade
Cypriots
99.8
/100
|
#60
Exceptional
95.0%
Chippewa
99.8
/100
|
#61
Exceptional
95.0%
Thais
99.8
/100
|
#62
Exceptional
95.0%
Immigrants | Singapore
99.8
/100
|
#63
Exceptional
95.0%
Native Hawaiians
99.7
/100
|
#64
Exceptional
95.0%
Turks
99.7
/100
|
#65
Exceptional
95.0%
Immigrants | Australia
99.7
/100
|
#66
Exceptional
94.9%
Immigrants | Netherlands
99.7
/100
|
#67
Exceptional
94.9%
Immigrants | Belgium
99.7
/100
|
#68
Exceptional
94.9%
Immigrants | England
99.6
/100
|
#69
Exceptional
94.9%
Zimbabweans
99.6
/100
|
#70
Exceptional
94.9%
Alaska Natives
99.6
/100
|
#71
Exceptional
94.9%
Immigrants | Sweden
99.6
/100
|
#72
Exceptional
94.9%
Bhutanese
99.6
/100
|
#73
Exceptional
94.9%
Canadians
99.6
/100
|
#74
Exceptional
94.9%

Demographics Similar to German Russians by 10th Grade

In terms of 10th grade, the demographic groups most similar to German Russians are Delaware (94.4%, a difference of 0.0%), Sioux (94.4%, a difference of 0.0%), Palestinian (94.4%, a difference of 0.020%), Immigrants from Kuwait (94.4%, a difference of 0.030%), and Immigrants from Hungary (94.4%, a difference of 0.030%).
DemographicsRating | Rank10th Grade
Immigrants | Croatia
97.4
/100
|
#107
Exceptional
94.5%
Immigrants | North Macedonia
97.2
/100
|
#108
Exceptional
94.5%
Immigrants | Norway
97.2
/100
|
#109
Exceptional
94.5%
Burmese
97.1
/100
|
#110
Exceptional
94.5%
Immigrants | Zimbabwe
96.8
/100
|
#111
Exceptional
94.4%
Immigrants | Kuwait
96.8
/100
|
#112
Exceptional
94.4%
Palestinians
96.5
/100
|
#113
Exceptional
94.4%
German Russians
96.3
/100
|
#114
Exceptional
94.4%
Delaware
96.3
/100
|
#115
Exceptional
94.4%
Sioux
96.2
/100
|
#116
Exceptional
94.4%
Immigrants | Hungary
95.8
/100
|
#117
Exceptional
94.4%
Jordanians
95.6
/100
|
#118
Exceptional
94.4%
Immigrants | Israel
95.4
/100
|
#119
Exceptional
94.4%
Immigrants | Taiwan
95.3
/100
|
#120
Exceptional
94.4%
Immigrants | Belarus
95.2
/100
|
#121
Exceptional
94.4%