Immigrants from Morocco vs Marshallese Doctorate Degree
COMPARE
Immigrants from Morocco
Marshallese
Doctorate Degree
Doctorate Degree Comparison
Immigrants from Morocco
Marshallese
2.0%
DOCTORATE DEGREE
95.5/ 100
METRIC RATING
120th/ 347
METRIC RANK
1.5%
DOCTORATE DEGREE
0.4/ 100
METRIC RATING
279th/ 347
METRIC RANK
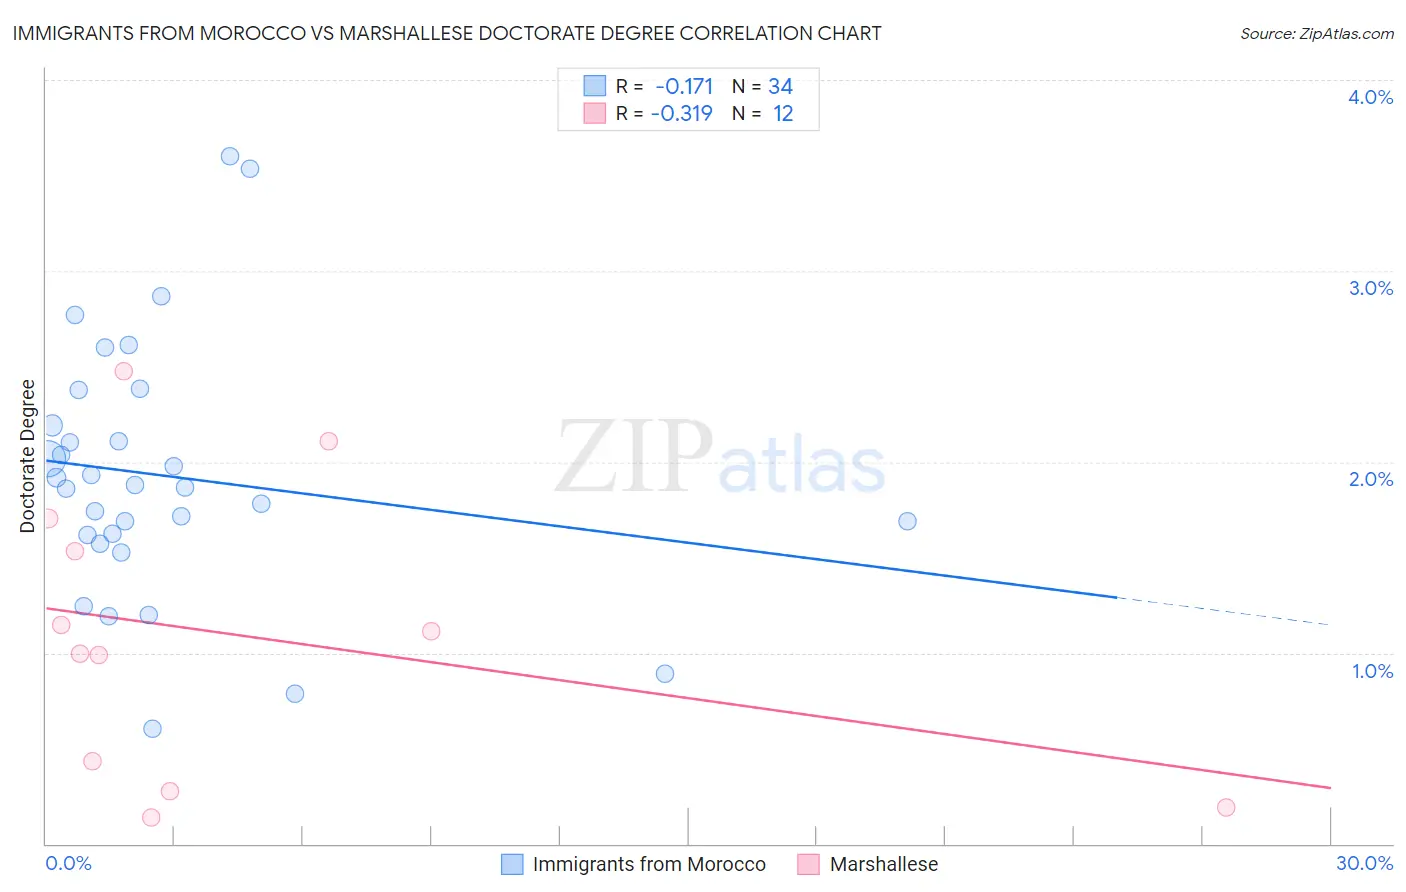
Immigrants from Morocco vs Marshallese Doctorate Degree Correlation Chart
The statistical analysis conducted on geographies consisting of 178,707,099 people shows a poor negative correlation between the proportion of Immigrants from Morocco and percentage of population with at least doctorate degree education in the United States with a correlation coefficient (R) of -0.171 and weighted average of 2.0%. Similarly, the statistical analysis conducted on geographies consisting of 14,742,598 people shows a mild negative correlation between the proportion of Marshallese and percentage of population with at least doctorate degree education in the United States with a correlation coefficient (R) of -0.319 and weighted average of 1.5%, a difference of 40.1%.
Doctorate Degree Correlation Summary
| Measurement | Immigrants from Morocco | Marshallese |
| Minimum | 0.60% | 0.14% |
| Maximum | 3.6% | 2.5% |
| Range | 3.0% | 2.3% |
| Mean | 1.9% | 1.1% |
| Median | 1.9% | 1.1% |
| Interquartile 25% (IQ1) | 1.6% | 0.35% |
| Interquartile 75% (IQ3) | 2.2% | 1.6% |
| Interquartile Range (IQR) | 0.57% | 1.3% |
| Standard Deviation (Sample) | 0.67% | 0.76% |
| Standard Deviation (Population) | 0.66% | 0.73% |
Similar Demographics by Doctorate Degree
Demographics Similar to Immigrants from Morocco by Doctorate Degree
In terms of doctorate degree, the demographic groups most similar to Immigrants from Morocco are Pakistani (2.0%, a difference of 0.28%), Icelander (2.1%, a difference of 0.42%), Lebanese (2.1%, a difference of 0.45%), Immigrants from Jordan (2.0%, a difference of 0.48%), and Immigrants from Southern Europe (2.0%, a difference of 0.50%).
| Demographics | Rating | Rank | Doctorate Degree |
| Immigrants | Italy | 96.9 /100 | #113 | Exceptional 2.1% |
| Immigrants | Croatia | 96.8 /100 | #114 | Exceptional 2.1% |
| Taiwanese | 96.7 /100 | #115 | Exceptional 2.1% |
| Maltese | 96.2 /100 | #116 | Exceptional 2.1% |
| Lebanese | 96.0 /100 | #117 | Exceptional 2.1% |
| Icelanders | 96.0 /100 | #118 | Exceptional 2.1% |
| Pakistanis | 95.8 /100 | #119 | Exceptional 2.0% |
| Immigrants | Morocco | 95.5 /100 | #120 | Exceptional 2.0% |
| Immigrants | Jordan | 94.8 /100 | #121 | Exceptional 2.0% |
| Immigrants | Southern Europe | 94.7 /100 | #122 | Exceptional 2.0% |
| Croatians | 94.0 /100 | #123 | Exceptional 2.0% |
| Ute | 93.2 /100 | #124 | Exceptional 2.0% |
| Moroccans | 93.0 /100 | #125 | Exceptional 2.0% |
| Jordanians | 92.1 /100 | #126 | Exceptional 2.0% |
| Palestinians | 92.0 /100 | #127 | Exceptional 2.0% |
Demographics Similar to Marshallese by Doctorate Degree
In terms of doctorate degree, the demographic groups most similar to Marshallese are Ecuadorian (1.5%, a difference of 0.010%), Tohono O'odham (1.5%, a difference of 0.080%), British West Indian (1.5%, a difference of 0.13%), Central American (1.5%, a difference of 0.18%), and Hawaiian (1.5%, a difference of 0.22%).
| Demographics | Rating | Rank | Doctorate Degree |
| Immigrants | Barbados | 0.4 /100 | #272 | Tragic 1.5% |
| Sioux | 0.4 /100 | #273 | Tragic 1.5% |
| Yaqui | 0.4 /100 | #274 | Tragic 1.5% |
| Aleuts | 0.4 /100 | #275 | Tragic 1.5% |
| Paiute | 0.4 /100 | #276 | Tragic 1.5% |
| Bahamians | 0.4 /100 | #277 | Tragic 1.5% |
| Hawaiians | 0.4 /100 | #278 | Tragic 1.5% |
| Marshallese | 0.4 /100 | #279 | Tragic 1.5% |
| Ecuadorians | 0.4 /100 | #280 | Tragic 1.5% |
| Tohono O'odham | 0.4 /100 | #281 | Tragic 1.5% |
| British West Indians | 0.3 /100 | #282 | Tragic 1.5% |
| Central Americans | 0.3 /100 | #283 | Tragic 1.5% |
| Jamaicans | 0.3 /100 | #284 | Tragic 1.5% |
| Malaysians | 0.3 /100 | #285 | Tragic 1.5% |
| Cherokee | 0.3 /100 | #286 | Tragic 1.5% |