Immigrants from Micronesia vs Immigrants from Syria 12th Grade, No Diploma
COMPARE
Immigrants from Micronesia
Immigrants from Syria
12th Grade, No Diploma
12th Grade, No Diploma Comparison
Immigrants from Micronesia
Immigrants from Syria
90.6%
12TH GRADE, NO DIPLOMA
11.0/ 100
METRIC RATING
208th/ 347
METRIC RANK
91.1%
12TH GRADE, NO DIPLOMA
40.3/ 100
METRIC RATING
180th/ 347
METRIC RANK
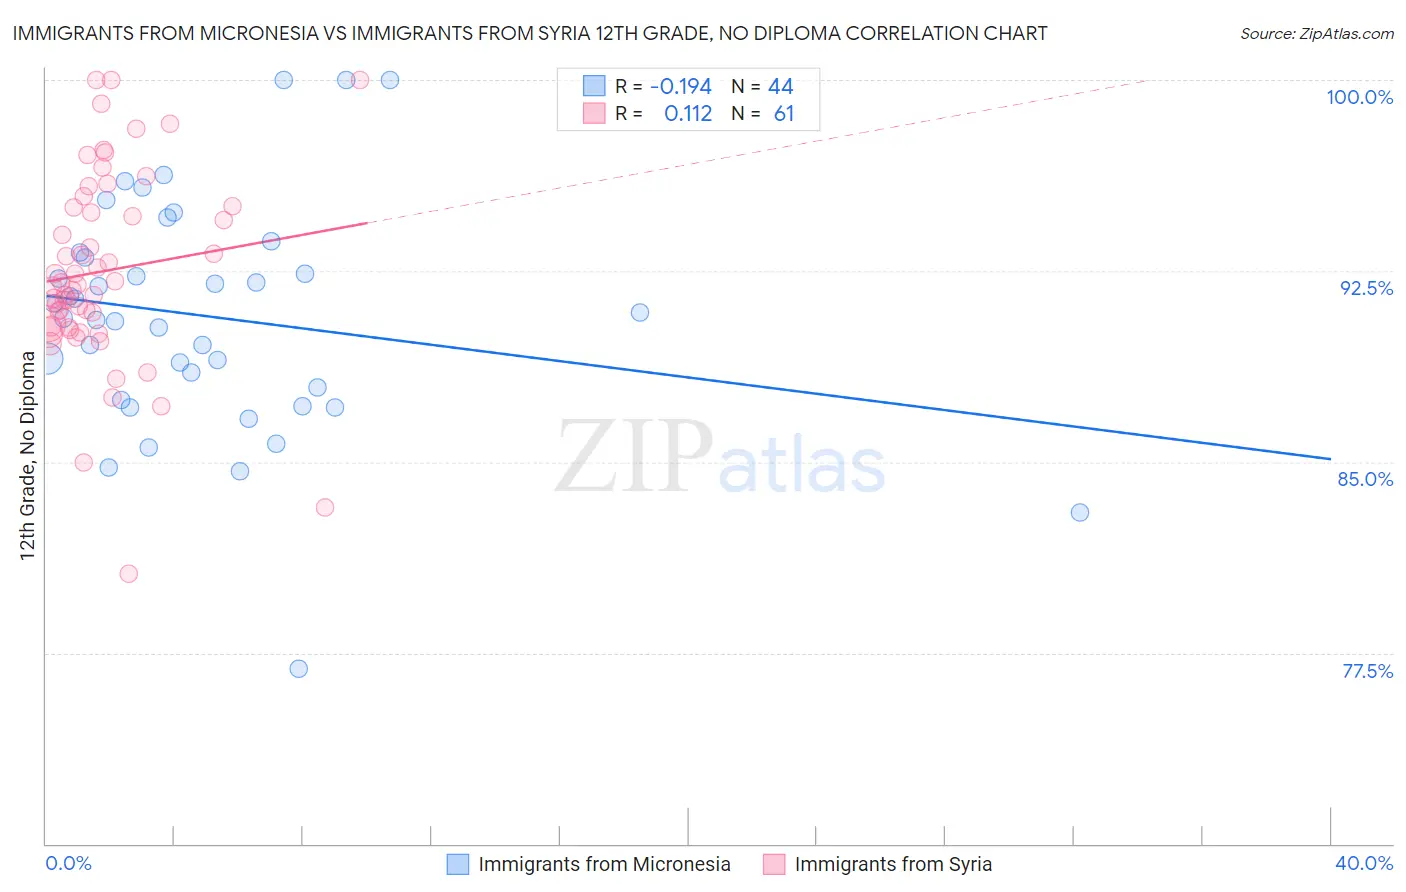
Immigrants from Micronesia vs Immigrants from Syria 12th Grade, No Diploma Correlation Chart
The statistical analysis conducted on geographies consisting of 61,609,499 people shows a poor negative correlation between the proportion of Immigrants from Micronesia and percentage of population with at least 12th grade (no diploma) education in the United States with a correlation coefficient (R) of -0.194 and weighted average of 90.6%. Similarly, the statistical analysis conducted on geographies consisting of 174,108,882 people shows a poor positive correlation between the proportion of Immigrants from Syria and percentage of population with at least 12th grade (no diploma) education in the United States with a correlation coefficient (R) of 0.112 and weighted average of 91.1%, a difference of 0.52%.
12th Grade, No Diploma Correlation Summary
| Measurement | Immigrants from Micronesia | Immigrants from Syria |
| Minimum | 76.9% | 80.6% |
| Maximum | 100.0% | 100.0% |
| Range | 23.1% | 19.4% |
| Mean | 90.7% | 92.5% |
| Median | 90.8% | 92.0% |
| Interquartile 25% (IQ1) | 87.7% | 90.3% |
| Interquartile 75% (IQ3) | 93.1% | 95.0% |
| Interquartile Range (IQR) | 5.5% | 4.7% |
| Standard Deviation (Sample) | 4.6% | 3.8% |
| Standard Deviation (Population) | 4.5% | 3.8% |
Similar Demographics by 12th Grade, No Diploma
Demographics Similar to Immigrants from Micronesia by 12th Grade, No Diploma
In terms of 12th grade, no diploma, the demographic groups most similar to Immigrants from Micronesia are Immigrants from Afghanistan (90.6%, a difference of 0.0%), South American Indian (90.6%, a difference of 0.0%), Portuguese (90.6%, a difference of 0.010%), Armenian (90.6%, a difference of 0.020%), and Somali (90.6%, a difference of 0.030%).
| Demographics | Rating | Rank | 12th Grade, No Diploma |
| Hawaiians | 19.7 /100 | #201 | Poor 90.8% |
| Marshallese | 18.2 /100 | #202 | Poor 90.7% |
| Tongans | 16.1 /100 | #203 | Poor 90.7% |
| French American Indians | 15.5 /100 | #204 | Poor 90.7% |
| Immigrants | Sierra Leone | 14.9 /100 | #205 | Poor 90.7% |
| Immigrants | Bolivia | 12.3 /100 | #206 | Poor 90.6% |
| Armenians | 11.6 /100 | #207 | Poor 90.6% |
| Immigrants | Micronesia | 11.0 /100 | #208 | Poor 90.6% |
| Immigrants | Afghanistan | 11.0 /100 | #209 | Poor 90.6% |
| South American Indians | 10.9 /100 | #210 | Poor 90.6% |
| Portuguese | 10.6 /100 | #211 | Poor 90.6% |
| Somalis | 10.2 /100 | #212 | Poor 90.6% |
| Costa Ricans | 9.4 /100 | #213 | Tragic 90.5% |
| Immigrants | Africa | 8.5 /100 | #214 | Tragic 90.5% |
| Arapaho | 7.7 /100 | #215 | Tragic 90.5% |
Demographics Similar to Immigrants from Syria by 12th Grade, No Diploma
In terms of 12th grade, no diploma, the demographic groups most similar to Immigrants from Syria are Guamanian/Chamorro (91.0%, a difference of 0.010%), Nonimmigrants (91.0%, a difference of 0.020%), Osage (91.0%, a difference of 0.020%), Spanish (91.1%, a difference of 0.040%), and Immigrants from Chile (91.1%, a difference of 0.040%).
| Demographics | Rating | Rank | 12th Grade, No Diploma |
| Bolivians | 50.4 /100 | #173 | Average 91.2% |
| Immigrants | Nepal | 50.0 /100 | #174 | Average 91.2% |
| Immigrants | Western Asia | 49.0 /100 | #175 | Average 91.2% |
| Iroquois | 48.5 /100 | #176 | Average 91.1% |
| Sierra Leoneans | 47.7 /100 | #177 | Average 91.1% |
| Spanish | 43.7 /100 | #178 | Average 91.1% |
| Immigrants | Chile | 43.3 /100 | #179 | Average 91.1% |
| Immigrants | Syria | 40.3 /100 | #180 | Average 91.1% |
| Guamanians/Chamorros | 39.5 /100 | #181 | Fair 91.0% |
| Immigrants | Nonimmigrants | 38.8 /100 | #182 | Fair 91.0% |
| Osage | 38.3 /100 | #183 | Fair 91.0% |
| Spaniards | 36.2 /100 | #184 | Fair 91.0% |
| Sudanese | 34.4 /100 | #185 | Fair 91.0% |
| Ethiopians | 33.9 /100 | #186 | Fair 91.0% |
| Potawatomi | 32.9 /100 | #187 | Fair 91.0% |