Immigrants from Mexico vs Subsaharan African 6th Grade
COMPARE
Immigrants from Mexico
Subsaharan African
6th Grade
6th Grade Comparison
Immigrants from Mexico
Sub-Saharan Africans
93.9%
6TH GRADE
0.0/ 100
METRIC RATING
343rd/ 347
METRIC RANK
96.7%
6TH GRADE
3.5/ 100
METRIC RATING
231st/ 347
METRIC RANK
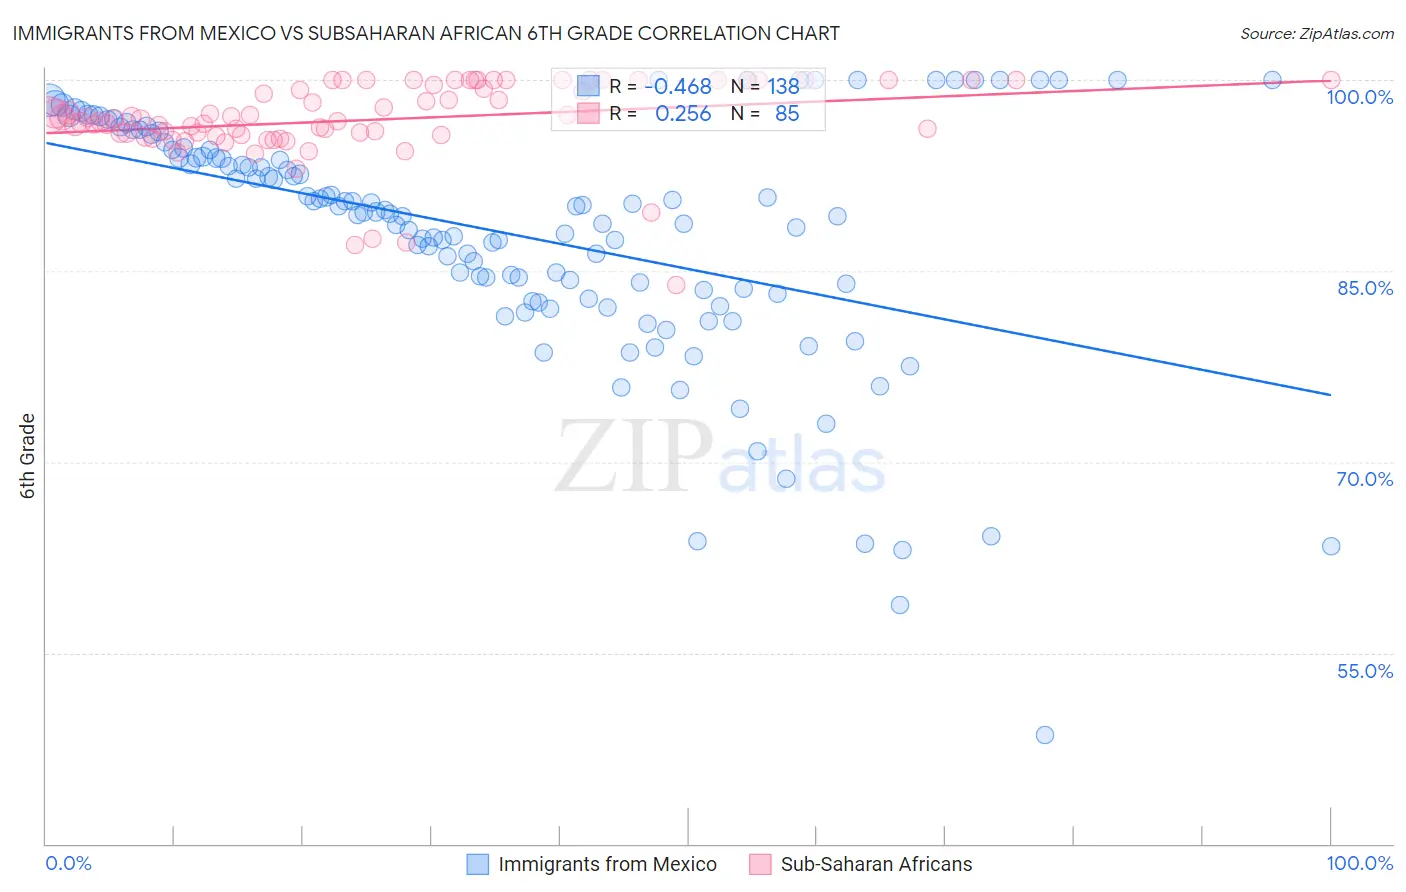
Immigrants from Mexico vs Subsaharan African 6th Grade Correlation Chart
The statistical analysis conducted on geographies consisting of 513,767,713 people shows a moderate negative correlation between the proportion of Immigrants from Mexico and percentage of population with at least 6th grade education in the United States with a correlation coefficient (R) of -0.468 and weighted average of 93.9%. Similarly, the statistical analysis conducted on geographies consisting of 508,219,094 people shows a weak positive correlation between the proportion of Sub-Saharan Africans and percentage of population with at least 6th grade education in the United States with a correlation coefficient (R) of 0.256 and weighted average of 96.7%, a difference of 2.9%.
6th Grade Correlation Summary
| Measurement | Immigrants from Mexico | Subsaharan African |
| Minimum | 48.6% | 83.9% |
| Maximum | 100.0% | 100.0% |
| Range | 51.4% | 16.1% |
| Mean | 88.0% | 96.9% |
| Median | 89.6% | 97.0% |
| Interquartile 25% (IQ1) | 83.5% | 95.7% |
| Interquartile 75% (IQ3) | 94.5% | 100.0% |
| Interquartile Range (IQR) | 11.0% | 4.3% |
| Standard Deviation (Sample) | 9.5% | 3.1% |
| Standard Deviation (Population) | 9.4% | 3.1% |
Similar Demographics by 6th Grade
Demographics Similar to Immigrants from Mexico by 6th Grade
In terms of 6th grade, the demographic groups most similar to Immigrants from Mexico are Immigrants from Guatemala (93.9%, a difference of 0.0%), Salvadoran (93.9%, a difference of 0.010%), Immigrants from Central America (94.0%, a difference of 0.060%), Immigrants from Yemen (94.1%, a difference of 0.16%), and Guatemalan (94.2%, a difference of 0.28%).
| Demographics | Rating | Rank | 6th Grade |
| Immigrants | Latin America | 0.0 /100 | #333 | Tragic 94.7% |
| Immigrants | Azores | 0.0 /100 | #334 | Tragic 94.7% |
| Mexicans | 0.0 /100 | #335 | Tragic 94.6% |
| Immigrants | Dominican Republic | 0.0 /100 | #336 | Tragic 94.6% |
| Central Americans | 0.0 /100 | #337 | Tragic 94.5% |
| Immigrants | Cabo Verde | 0.0 /100 | #338 | Tragic 94.4% |
| Yakama | 0.0 /100 | #339 | Tragic 94.3% |
| Guatemalans | 0.0 /100 | #340 | Tragic 94.2% |
| Immigrants | Yemen | 0.0 /100 | #341 | Tragic 94.1% |
| Immigrants | Central America | 0.0 /100 | #342 | Tragic 94.0% |
| Immigrants | Mexico | 0.0 /100 | #343 | Tragic 93.9% |
| Immigrants | Guatemala | 0.0 /100 | #344 | Tragic 93.9% |
| Salvadorans | 0.0 /100 | #345 | Tragic 93.9% |
| Spanish American Indians | 0.0 /100 | #346 | Tragic 93.6% |
| Immigrants | El Salvador | 0.0 /100 | #347 | Tragic 93.6% |
Demographics Similar to Sub-Saharan Africans by 6th Grade
In terms of 6th grade, the demographic groups most similar to Sub-Saharan Africans are South American Indian (96.7%, a difference of 0.0%), Immigrants from Eastern Asia (96.7%, a difference of 0.010%), Yuman (96.7%, a difference of 0.010%), Immigrants from Panama (96.7%, a difference of 0.020%), and Immigrants from Western Asia (96.7%, a difference of 0.020%).
| Demographics | Rating | Rank | 6th Grade |
| Immigrants | Southern Europe | 4.4 /100 | #224 | Tragic 96.7% |
| Immigrants | Pakistan | 4.4 /100 | #225 | Tragic 96.7% |
| Immigrants | Panama | 4.2 /100 | #226 | Tragic 96.7% |
| Immigrants | Western Asia | 4.1 /100 | #227 | Tragic 96.7% |
| Immigrants | Malaysia | 4.0 /100 | #228 | Tragic 96.7% |
| Assyrians/Chaldeans/Syriacs | 4.0 /100 | #229 | Tragic 96.7% |
| Immigrants | Eastern Asia | 4.0 /100 | #230 | Tragic 96.7% |
| Sub-Saharan Africans | 3.5 /100 | #231 | Tragic 96.7% |
| South American Indians | 3.5 /100 | #232 | Tragic 96.7% |
| Yuman | 3.2 /100 | #233 | Tragic 96.7% |
| Uruguayans | 2.5 /100 | #234 | Tragic 96.6% |
| Asians | 2.4 /100 | #235 | Tragic 96.6% |
| Immigrants | Indonesia | 2.3 /100 | #236 | Tragic 96.6% |
| Immigrants | Eastern Africa | 2.0 /100 | #237 | Tragic 96.6% |
| Nigerians | 1.9 /100 | #238 | Tragic 96.6% |