Immigrants from Lithuania vs Seminole Master's Degree
COMPARE
Immigrants from Lithuania
Seminole
Master's Degree
Master's Degree Comparison
Immigrants from Lithuania
Seminole
18.5%
MASTER'S DEGREE
99.9/ 100
METRIC RATING
54th/ 347
METRIC RANK
11.0%
MASTER'S DEGREE
0.0/ 100
METRIC RATING
311th/ 347
METRIC RANK
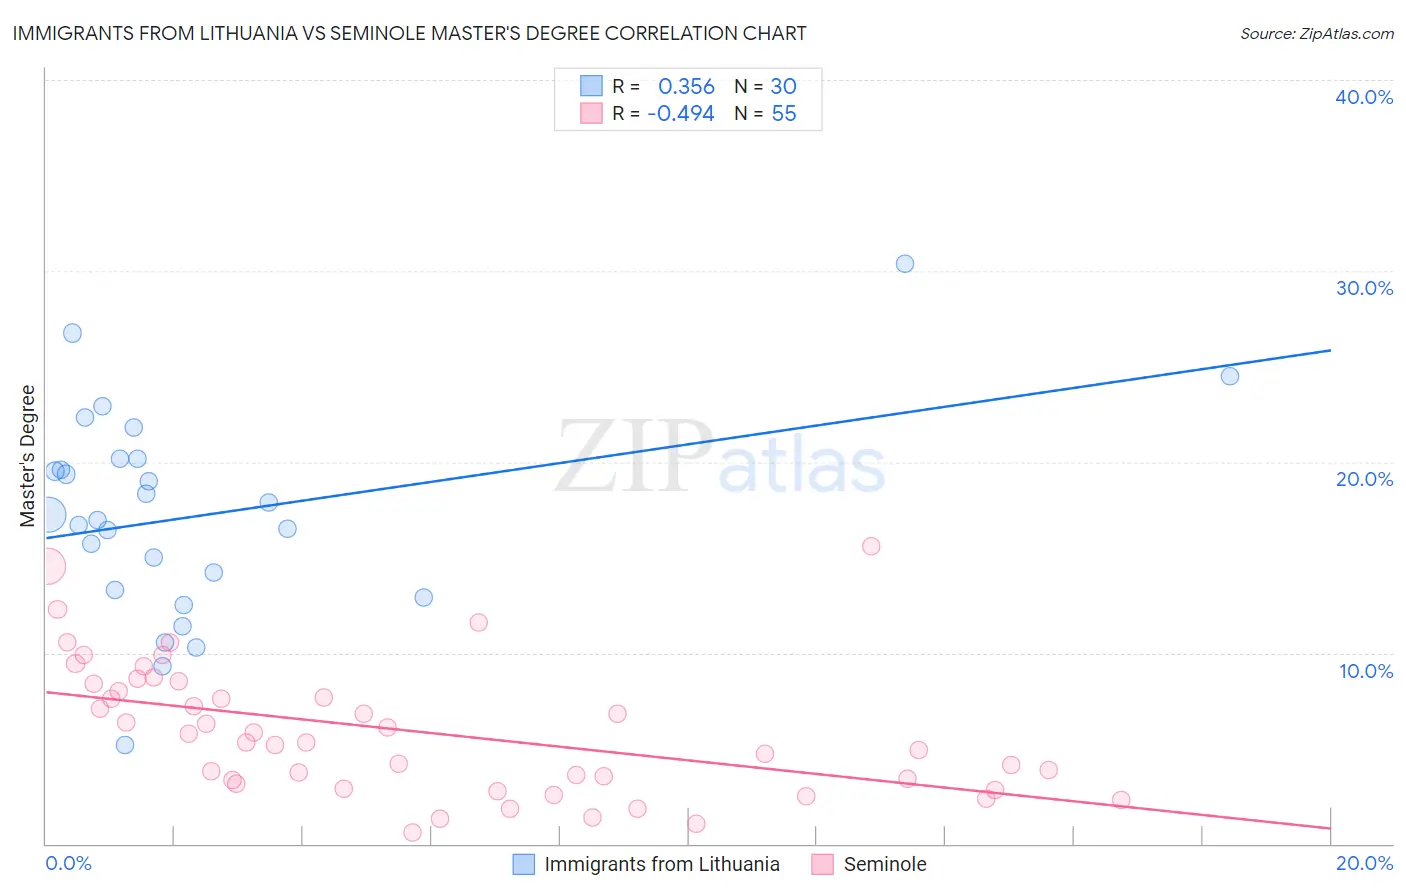
Immigrants from Lithuania vs Seminole Master's Degree Correlation Chart
The statistical analysis conducted on geographies consisting of 117,722,731 people shows a mild positive correlation between the proportion of Immigrants from Lithuania and percentage of population with at least master's degree education in the United States with a correlation coefficient (R) of 0.356 and weighted average of 18.5%. Similarly, the statistical analysis conducted on geographies consisting of 118,305,652 people shows a moderate negative correlation between the proportion of Seminole and percentage of population with at least master's degree education in the United States with a correlation coefficient (R) of -0.494 and weighted average of 11.0%, a difference of 67.5%.
Master's Degree Correlation Summary
| Measurement | Immigrants from Lithuania | Seminole |
| Minimum | 5.1% | 0.60% |
| Maximum | 30.4% | 15.6% |
| Range | 25.3% | 15.0% |
| Mean | 17.2% | 5.9% |
| Median | 17.1% | 5.3% |
| Interquartile 25% (IQ1) | 13.3% | 3.2% |
| Interquartile 75% (IQ3) | 20.1% | 8.4% |
| Interquartile Range (IQR) | 6.8% | 5.2% |
| Standard Deviation (Sample) | 5.4% | 3.5% |
| Standard Deviation (Population) | 5.3% | 3.4% |
Similar Demographics by Master's Degree
Demographics Similar to Immigrants from Lithuania by Master's Degree
In terms of master's degree, the demographic groups most similar to Immigrants from Lithuania are Immigrants from Serbia (18.5%, a difference of 0.030%), Asian (18.4%, a difference of 0.26%), Immigrants from Czechoslovakia (18.5%, a difference of 0.31%), Immigrants from Kuwait (18.6%, a difference of 0.39%), and Immigrants from Asia (18.4%, a difference of 0.39%).
| Demographics | Rating | Rank | Master's Degree |
| Immigrants | Austria | 100.0 /100 | #47 | Exceptional 18.8% |
| Paraguayans | 100.0 /100 | #48 | Exceptional 18.8% |
| Estonians | 100.0 /100 | #49 | Exceptional 18.8% |
| Bulgarians | 100.0 /100 | #50 | Exceptional 18.8% |
| Immigrants | South Africa | 100.0 /100 | #51 | Exceptional 18.8% |
| Immigrants | Kuwait | 100.0 /100 | #52 | Exceptional 18.6% |
| Immigrants | Czechoslovakia | 99.9 /100 | #53 | Exceptional 18.5% |
| Immigrants | Lithuania | 99.9 /100 | #54 | Exceptional 18.5% |
| Immigrants | Serbia | 99.9 /100 | #55 | Exceptional 18.5% |
| Asians | 99.9 /100 | #56 | Exceptional 18.4% |
| Immigrants | Asia | 99.9 /100 | #57 | Exceptional 18.4% |
| Australians | 99.9 /100 | #58 | Exceptional 18.4% |
| Immigrants | Bulgaria | 99.9 /100 | #59 | Exceptional 18.3% |
| New Zealanders | 99.9 /100 | #60 | Exceptional 18.3% |
| Immigrants | Europe | 99.9 /100 | #61 | Exceptional 18.2% |
Demographics Similar to Seminole by Master's Degree
In terms of master's degree, the demographic groups most similar to Seminole are Choctaw (11.0%, a difference of 0.10%), Yaqui (11.0%, a difference of 0.27%), Shoshone (11.1%, a difference of 0.51%), Cajun (11.0%, a difference of 0.67%), and Apache (11.0%, a difference of 0.67%).
| Demographics | Rating | Rank | Master's Degree |
| Immigrants | Cabo Verde | 0.1 /100 | #304 | Tragic 11.3% |
| Immigrants | Latin America | 0.0 /100 | #305 | Tragic 11.3% |
| Mexican American Indians | 0.0 /100 | #306 | Tragic 11.2% |
| Cheyenne | 0.0 /100 | #307 | Tragic 11.2% |
| Puerto Ricans | 0.0 /100 | #308 | Tragic 11.2% |
| Puget Sound Salish | 0.0 /100 | #309 | Tragic 11.1% |
| Shoshone | 0.0 /100 | #310 | Tragic 11.1% |
| Seminole | 0.0 /100 | #311 | Tragic 11.0% |
| Choctaw | 0.0 /100 | #312 | Tragic 11.0% |
| Yaqui | 0.0 /100 | #313 | Tragic 11.0% |
| Cajuns | 0.0 /100 | #314 | Tragic 11.0% |
| Apache | 0.0 /100 | #315 | Tragic 11.0% |
| Hispanics or Latinos | 0.0 /100 | #316 | Tragic 10.9% |
| Hopi | 0.0 /100 | #317 | Tragic 10.9% |
| Immigrants | Cuba | 0.0 /100 | #318 | Tragic 10.9% |