Immigrants from Liberia vs Immigrants from France 3rd Grade

COMPARE

Immigrants from Liberia
Race
Ancestry
AfghanAfricanAlaska NativeAlaskan AthabascanAlbanianAleutAlsatianAmericanApacheArabArapahoArgentineanArmenianAssyrian/Chaldean/SyriacAustralianAustrianBahamianBangladeshiBarbadianBasqueBelgianBelizeanBermudanBhutaneseBlackfeetBolivianBrazilianBritishBritish West IndianBulgarianBurmeseCajunCambodianCanadianCape VerdeanCarpatho RusynCelticCentral AmericanCentral American IndianCherokeeCheyenneChickasawChileanChineseChippewaChoctawColombianColvilleComancheCosta RicanCreeCreekCroatianCrowCubanCypriotCzechCzechoslovakianDanishDelawareDominicanDutchDutch West IndianEastern EuropeanEcuadorianEgyptianEnglishEstonianEthiopianEuropeanFijianFilipinoFinnishFrenchFrench American IndianFrench CanadianGermanGerman RussianGhanaianGreekGuamanian/ChamorroGuatemalanGuyaneseHaitianHmongHonduranHopiHoumaHungarianIcelanderIndian (Asian)IndonesianInupiatIranianIraqiIrishIroquoisIsraeliItalianJamaicanJapaneseJordanianKenyanKiowaKoreanLaotianLatvianLebaneseLiberianLithuanianLumbeeLuxembourgerMacedonianMalaysianMalteseMarshalleseMenomineeMexicanMexican American IndianMongolianMoroccanNative HawaiianNavajoNepaleseNew ZealanderNicaraguanNigerianNorthern EuropeanNorwegianOkinawanOsageOttawaPaiutePakistaniPalestinianPanamanianParaguayanPennsylvania GermanPeruvianPimaPolishPortuguesePotawatomiPuebloPuerto RicanPuget Sound SalishRomanianRussianSalvadoranSamoanScandinavianScotch-IrishScottishSeminoleSenegaleseSerbianShoshoneSierra LeoneanSiouxSlavicSlovakSloveneSomaliSouth AfricanSouth AmericanSouth American IndianSoviet UnionSpaniardSpanishSpanish AmericanSpanish American IndianSri LankanSubsaharan AfricanSudaneseSwedishSwissSyrianTaiwaneseThaiTlingit-HaidaTohono O'OdhamTonganTrinidadian and TobagonianTsimshianTurkishU.S. Virgin IslanderUgandanUkrainianUruguayanUteVenezuelanVietnameseWelshWest IndianYakamaYaquiYugoslavianYumanYup'ikZimbabwean
Immigration
NonimmigrantsImmigrantsAfghanistanAfricaAlbaniaArgentinaArmeniaAsiaAustraliaAustriaBahamasBangladeshBarbadosBelarusBelgiumBelizeBoliviaBosnia and HerzegovinaBrazilBulgariaBurma/MyanmarCabo VerdeCambodiaCameroonCanadaCaribbeanCentral AmericaChileChinaColombiaCongoCosta RicaCroatiaCubaCzechoslovakiaDenmarkDominicaDominican RepublicEastern AfricaEastern AsiaEastern EuropeEcuadorEgyptEl SalvadorEnglandEritreaEthiopiaEuropeFijiGermanyGhanaGreeceGrenadaGuatemalaGuyanaHaitiHondurasHong KongHungaryIndiaIndonesiaIranIraqIrelandIsraelItalyJamaicaJapanJordanKazakhstanKenyaKoreaKuwaitLaosLatin AmericaLatviaLebanonLiberiaLithuaniaMalaysiaMexicoMicronesiaMiddle AfricaMoldovaMoroccoNepalNetherlandsNicaraguaNigeriaNorth AmericaNorth MacedoniaNorthern AfricaNorthern EuropeNorwayOceaniaPakistanPanamaPeruPhilippinesPolandPortugalRomaniaRussiaSaudi ArabiaScotlandSenegalSerbiaSierra LeoneSingaporeSomaliaSouth AfricaSouth AmericaSouth Central AsiaSouth Eastern AsiaSouthern EuropeSpainSri LankaSt. Vincent and the GrenadinesSudanSwedenSwitzerlandSyriaTaiwanThailandTrinidad and TobagoTurkeyUgandaUkraineUruguayUzbekistanVenezuelaVietnamWest IndiesWestern AfricaWestern AsiaWestern EuropeYemenZaireZimbabweAzores
Immigrants from France
Race
Ancestry
AfghanAfricanAlaska NativeAlaskan AthabascanAlbanianAleutAlsatianAmericanApacheArabArapahoArgentineanArmenianAssyrian/Chaldean/SyriacAustralianAustrianBahamianBangladeshiBarbadianBasqueBelgianBelizeanBermudanBhutaneseBlackfeetBolivianBrazilianBritishBritish West IndianBulgarianBurmeseCajunCambodianCanadianCape VerdeanCarpatho RusynCelticCentral AmericanCentral American IndianCherokeeCheyenneChickasawChileanChineseChippewaChoctawColombianColvilleComancheCosta RicanCreeCreekCroatianCrowCubanCypriotCzechCzechoslovakianDanishDelawareDominicanDutchDutch West IndianEastern EuropeanEcuadorianEgyptianEnglishEstonianEthiopianEuropeanFijianFilipinoFinnishFrenchFrench American IndianFrench CanadianGermanGerman RussianGhanaianGreekGuamanian/ChamorroGuatemalanGuyaneseHaitianHmongHonduranHopiHoumaHungarianIcelanderIndian (Asian)IndonesianInupiatIranianIraqiIrishIroquoisIsraeliItalianJamaicanJapaneseJordanianKenyanKiowaKoreanLaotianLatvianLebaneseLiberianLithuanianLumbeeLuxembourgerMacedonianMalaysianMalteseMarshalleseMenomineeMexicanMexican American IndianMongolianMoroccanNative HawaiianNavajoNepaleseNew ZealanderNicaraguanNigerianNorthern EuropeanNorwegianOkinawanOsageOttawaPaiutePakistaniPalestinianPanamanianParaguayanPennsylvania GermanPeruvianPimaPolishPortuguesePotawatomiPuebloPuerto RicanPuget Sound SalishRomanianRussianSalvadoranSamoanScandinavianScotch-IrishScottishSeminoleSenegaleseSerbianShoshoneSierra LeoneanSiouxSlavicSlovakSloveneSomaliSouth AfricanSouth AmericanSouth American IndianSoviet UnionSpaniardSpanishSpanish AmericanSpanish American IndianSri LankanSubsaharan AfricanSudaneseSwedishSwissSyrianTaiwaneseThaiTlingit-HaidaTohono O'OdhamTonganTrinidadian and TobagonianTsimshianTurkishU.S. Virgin IslanderUgandanUkrainianUruguayanUteVenezuelanVietnameseWelshWest IndianYakamaYaquiYugoslavianYumanYup'ikZimbabwean
Immigration
NonimmigrantsImmigrantsAfghanistanAfricaAlbaniaArgentinaArmeniaAsiaAustraliaAustriaBahamasBangladeshBarbadosBelarusBelgiumBelizeBoliviaBosnia and HerzegovinaBrazilBulgariaBurma/MyanmarCabo VerdeCambodiaCameroonCanadaCaribbeanCentral AmericaChileChinaColombiaCongoCosta RicaCroatiaCubaCzechoslovakiaDenmarkDominicaDominican RepublicEastern AfricaEastern AsiaEastern EuropeEcuadorEgyptEl SalvadorEnglandEritreaEthiopiaEuropeFijiFranceGermanyGhanaGreeceGrenadaGuatemalaGuyanaHaitiHondurasHong KongHungaryIndiaIndonesiaIranIraqIrelandIsraelItalyJamaicaJapanJordanKazakhstanKenyaKoreaKuwaitLaosLatin AmericaLatviaLebanonLithuaniaMalaysiaMexicoMicronesiaMiddle AfricaMoldovaMoroccoNepalNetherlandsNicaraguaNigeriaNorth AmericaNorth MacedoniaNorthern AfricaNorthern EuropeNorwayOceaniaPakistanPanamaPeruPhilippinesPolandPortugalRomaniaRussiaSaudi ArabiaScotlandSenegalSerbiaSierra LeoneSingaporeSomaliaSouth AfricaSouth AmericaSouth Central AsiaSouth Eastern AsiaSouthern EuropeSpainSri LankaSt. Vincent and the GrenadinesSudanSwedenSwitzerlandSyriaTaiwanThailandTrinidad and TobagoTurkeyUgandaUkraineUruguayUzbekistanVenezuelaVietnamWest IndiesWestern AfricaWestern AsiaWestern EuropeYemenZaireZimbabweAzores
3rd Grade
Income
Poverty
Unemployment
Labor Participation
Family Structure
Vehicle Availability
Education Level
Disability

3rd Grade Comparison

Immigrants from Liberia

Immigrants from France

Tragic
Exceptional
97.3%
3RD GRADE
0.5/ 100
METRIC RATING
258th/ 347
METRIC RANK
98.0%
3RD GRADE
95.1/ 100
METRIC RATING
117th/ 347
METRIC RANK

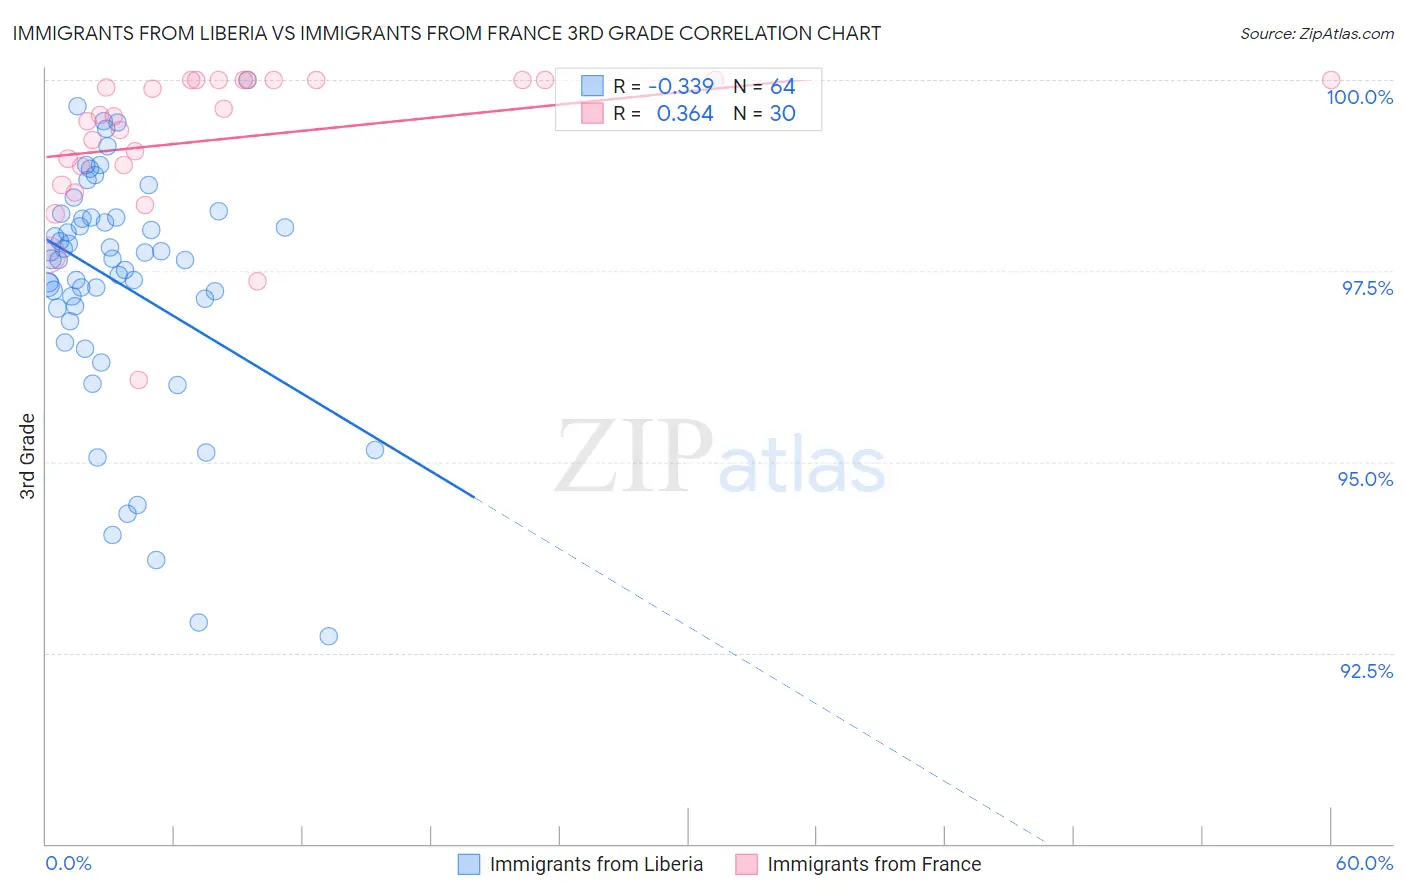
Immigrants from Liberia vs Immigrants from France 3rd Grade Correlation Chart

The statistical analysis conducted on geographies consisting of 135,294,272 people shows a mild negative correlation between the proportion of Immigrants from Liberia and percentage of population with at least 3rd grade education in the United States with a correlation coefficient (R) of -0.339 and weighted average of 97.3%. Similarly, the statistical analysis conducted on geographies consisting of 287,920,814 people shows a mild positive correlation between the proportion of Immigrants from France and percentage of population with at least 3rd grade education in the United States with a correlation coefficient (R) of 0.364 and weighted average of 98.0%, a difference of 0.71%.
Immigrants from Liberia vs Immigrants from France 3rd Grade

3rd Grade Correlation Summary

MeasurementImmigrants from LiberiaImmigrants from France
Minimum92.7%96.1%
Maximum100.0%100.0%
Range7.3%3.9%
Mean97.3%99.2%
Median97.7%99.5%
Interquartile 25% (IQ1)97.0%98.9%
Interquartile 75% (IQ3)98.2%100.0%
Interquartile Range (IQR)1.2%1.1%
Standard Deviation (Sample)1.6%0.96%
Standard Deviation (Population)1.6%0.94%

Similar Demographics by 3rd Grade

Demographics Similar to Immigrants from Liberia by 3rd Grade

In terms of 3rd grade, the demographic groups most similar to Immigrants from Liberia are Immigrants from Colombia (97.3%, a difference of 0.010%), Armenian (97.3%, a difference of 0.010%), Immigrants from Ethiopia (97.3%, a difference of 0.010%), Bolivian (97.3%, a difference of 0.020%), and Immigrants from Congo (97.3%, a difference of 0.020%).
DemographicsRating | Rank3rd Grade
Immigrants | Asia
0.8
/100
|
#251
Tragic
97.4%
Peruvians
0.8
/100
|
#252
Tragic
97.4%
Immigrants | Africa
0.8
/100
|
#253
Tragic
97.4%
Jamaicans
0.7
/100
|
#254
Tragic
97.4%
Bolivians
0.6
/100
|
#255
Tragic
97.3%
Immigrants | Congo
0.6
/100
|
#256
Tragic
97.3%
Immigrants | Colombia
0.5
/100
|
#257
Tragic
97.3%
Immigrants | Liberia
0.5
/100
|
#258
Tragic
97.3%
Armenians
0.4
/100
|
#259
Tragic
97.3%
Immigrants | Ethiopia
0.4
/100
|
#260
Tragic
97.3%
Immigrants | South America
0.4
/100
|
#261
Tragic
97.3%
Immigrants | Sierra Leone
0.4
/100
|
#262
Tragic
97.3%
Taiwanese
0.3
/100
|
#263
Tragic
97.3%
West Indians
0.3
/100
|
#264
Tragic
97.3%
Immigrants | Jamaica
0.3
/100
|
#265
Tragic
97.3%

Demographics Similar to Immigrants from France by 3rd Grade

In terms of 3rd grade, the demographic groups most similar to Immigrants from France are Okinawan (98.0%, a difference of 0.0%), Immigrants from Norway (98.0%, a difference of 0.0%), Iranian (98.0%, a difference of 0.0%), Thai (98.0%, a difference of 0.010%), and Menominee (98.0%, a difference of 0.010%).
DemographicsRating | Rank3rd Grade
Immigrants | Switzerland
96.6
/100
|
#110
Exceptional
98.0%
Basques
96.5
/100
|
#111
Exceptional
98.0%
Immigrants | Latvia
96.0
/100
|
#112
Exceptional
98.0%
Thais
95.5
/100
|
#113
Exceptional
98.0%
Menominee
95.4
/100
|
#114
Exceptional
98.0%
Okinawans
95.2
/100
|
#115
Exceptional
98.0%
Immigrants | Norway
95.2
/100
|
#116
Exceptional
98.0%
Immigrants | France
95.1
/100
|
#117
Exceptional
98.0%
Iranians
94.9
/100
|
#118
Exceptional
98.0%
Spanish
94.8
/100
|
#119
Exceptional
98.0%
Immigrants | Croatia
94.4
/100
|
#120
Exceptional
98.0%
Iroquois
94.1
/100
|
#121
Exceptional
98.0%
Lebanese
94.1
/100
|
#122
Exceptional
98.0%
Syrians
93.8
/100
|
#123
Exceptional
98.0%
Immigrants | Japan
93.7
/100
|
#124
Exceptional
98.0%