Immigrants from Liberia vs Immigrants from Barbados Doctorate Degree
COMPARE
Immigrants from Liberia
Immigrants from Barbados
Doctorate Degree
Doctorate Degree Comparison
Immigrants from Liberia
Immigrants from Barbados
1.5%
DOCTORATE DEGREE
0.5/ 100
METRIC RATING
266th/ 347
METRIC RANK
1.5%
DOCTORATE DEGREE
0.4/ 100
METRIC RATING
272nd/ 347
METRIC RANK
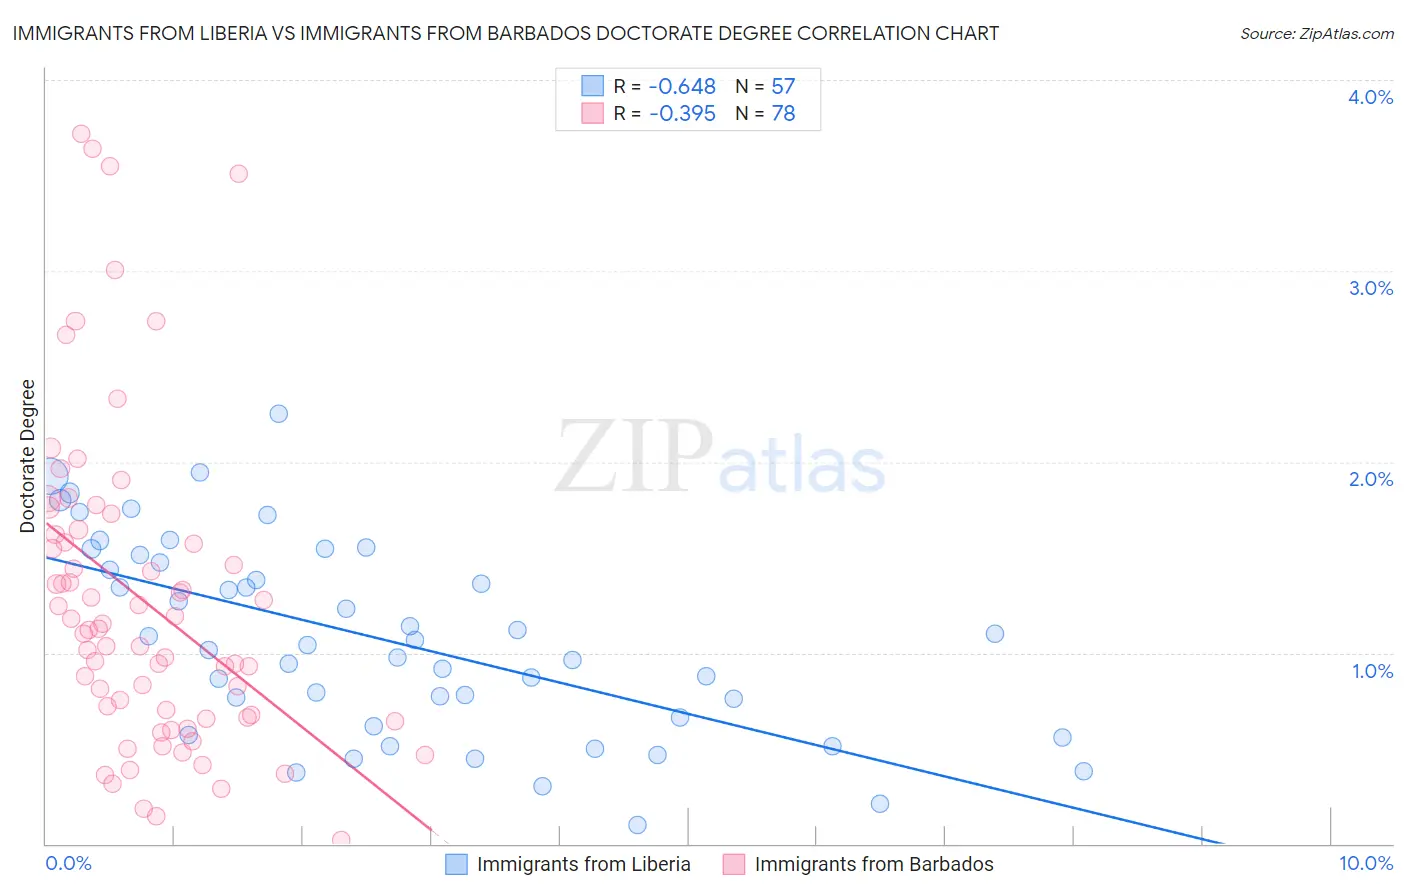
Immigrants from Liberia vs Immigrants from Barbados Doctorate Degree Correlation Chart
The statistical analysis conducted on geographies consisting of 134,868,003 people shows a significant negative correlation between the proportion of Immigrants from Liberia and percentage of population with at least doctorate degree education in the United States with a correlation coefficient (R) of -0.648 and weighted average of 1.5%. Similarly, the statistical analysis conducted on geographies consisting of 112,445,982 people shows a mild negative correlation between the proportion of Immigrants from Barbados and percentage of population with at least doctorate degree education in the United States with a correlation coefficient (R) of -0.395 and weighted average of 1.5%, a difference of 0.93%.
Doctorate Degree Correlation Summary
| Measurement | Immigrants from Liberia | Immigrants from Barbados |
| Minimum | 0.100% | 0.017% |
| Maximum | 2.2% | 3.7% |
| Range | 2.1% | 3.7% |
| Mean | 1.1% | 1.3% |
| Median | 1.0% | 1.1% |
| Interquartile 25% (IQ1) | 0.64% | 0.66% |
| Interquartile 75% (IQ3) | 1.5% | 1.6% |
| Interquartile Range (IQR) | 0.85% | 0.96% |
| Standard Deviation (Sample) | 0.51% | 0.84% |
| Standard Deviation (Population) | 0.50% | 0.83% |
Demographics Similar to Immigrants from Liberia and Immigrants from Barbados by Doctorate Degree
In terms of doctorate degree, the demographic groups most similar to Immigrants from Liberia are Kiowa (1.5%, a difference of 0.65%), U.S. Virgin Islander (1.5%, a difference of 0.65%), Crow (1.5%, a difference of 0.74%), Salvadoran (1.5%, a difference of 0.77%), and Nicaraguan (1.5%, a difference of 0.78%). Similarly, the demographic groups most similar to Immigrants from Barbados are Immigrants from Trinidad and Tobago (1.5%, a difference of 0.090%), Sioux (1.5%, a difference of 0.11%), Yaqui (1.5%, a difference of 0.13%), Salvadoran (1.5%, a difference of 0.16%), and Crow (1.5%, a difference of 0.19%).
| Demographics | Rating | Rank | Doctorate Degree |
| Liberians | 0.9 /100 | #259 | Tragic 1.5% |
| Japanese | 0.9 /100 | #260 | Tragic 1.5% |
| Immigrants | Portugal | 0.8 /100 | #261 | Tragic 1.5% |
| Chickasaw | 0.7 /100 | #262 | Tragic 1.5% |
| Immigrants | Bahamas | 0.7 /100 | #263 | Tragic 1.5% |
| Blackfeet | 0.7 /100 | #264 | Tragic 1.5% |
| Nicaraguans | 0.6 /100 | #265 | Tragic 1.5% |
| Immigrants | Liberia | 0.5 /100 | #266 | Tragic 1.5% |
| Kiowa | 0.5 /100 | #267 | Tragic 1.5% |
| U.S. Virgin Islanders | 0.5 /100 | #268 | Tragic 1.5% |
| Crow | 0.5 /100 | #269 | Tragic 1.5% |
| Salvadorans | 0.5 /100 | #270 | Tragic 1.5% |
| Immigrants | Trinidad and Tobago | 0.5 /100 | #271 | Tragic 1.5% |
| Immigrants | Barbados | 0.4 /100 | #272 | Tragic 1.5% |
| Sioux | 0.4 /100 | #273 | Tragic 1.5% |
| Yaqui | 0.4 /100 | #274 | Tragic 1.5% |
| Aleuts | 0.4 /100 | #275 | Tragic 1.5% |
| Paiute | 0.4 /100 | #276 | Tragic 1.5% |
| Bahamians | 0.4 /100 | #277 | Tragic 1.5% |
| Hawaiians | 0.4 /100 | #278 | Tragic 1.5% |
| Marshallese | 0.4 /100 | #279 | Tragic 1.5% |