Immigrants from Latin America vs Polish 11th Grade

COMPARE

Immigrants from Latin America
Race
Ancestry
AfghanAfricanAlaska NativeAlaskan AthabascanAlbanianAleutAlsatianAmericanApacheArabArapahoArgentineanArmenianAssyrian/Chaldean/SyriacAustralianAustrianBahamianBangladeshiBarbadianBasqueBelgianBelizeanBermudanBhutaneseBlackfeetBolivianBrazilianBritishBritish West IndianBulgarianBurmeseCajunCambodianCanadianCape VerdeanCarpatho RusynCelticCentral AmericanCentral American IndianCherokeeCheyenneChickasawChileanChineseChippewaChoctawColombianColvilleComancheCosta RicanCreeCreekCroatianCrowCubanCypriotCzechCzechoslovakianDanishDelawareDominicanDutchDutch West IndianEastern EuropeanEcuadorianEgyptianEnglishEstonianEthiopianEuropeanFijianFilipinoFinnishFrenchFrench American IndianFrench CanadianGermanGerman RussianGhanaianGreekGuamanian/ChamorroGuatemalanGuyaneseHaitianHmongHonduranHopiHoumaHungarianIcelanderIndian (Asian)IndonesianInupiatIranianIraqiIrishIroquoisIsraeliItalianJamaicanJapaneseJordanianKenyanKiowaKoreanLaotianLatvianLebaneseLiberianLithuanianLumbeeLuxembourgerMacedonianMalaysianMalteseMarshalleseMenomineeMexicanMexican American IndianMongolianMoroccanNative HawaiianNavajoNepaleseNew ZealanderNicaraguanNigerianNorthern EuropeanNorwegianOkinawanOsageOttawaPaiutePakistaniPalestinianPanamanianParaguayanPennsylvania GermanPeruvianPimaPortuguesePotawatomiPuebloPuerto RicanPuget Sound SalishRomanianRussianSalvadoranSamoanScandinavianScotch-IrishScottishSeminoleSenegaleseSerbianShoshoneSierra LeoneanSiouxSlavicSlovakSloveneSomaliSouth AfricanSouth AmericanSouth American IndianSoviet UnionSpaniardSpanishSpanish AmericanSpanish American IndianSri LankanSubsaharan AfricanSudaneseSwedishSwissSyrianTaiwaneseThaiTlingit-HaidaTohono O'OdhamTonganTrinidadian and TobagonianTsimshianTurkishU.S. Virgin IslanderUgandanUkrainianUruguayanUteVenezuelanVietnameseWelshWest IndianYakamaYaquiYugoslavianYumanYup'ikZimbabwean
Immigration
NonimmigrantsImmigrantsAfghanistanAfricaAlbaniaArgentinaArmeniaAsiaAustraliaAustriaBahamasBangladeshBarbadosBelarusBelgiumBelizeBoliviaBosnia and HerzegovinaBrazilBulgariaBurma/MyanmarCabo VerdeCambodiaCameroonCanadaCaribbeanCentral AmericaChileChinaColombiaCongoCosta RicaCroatiaCubaCzechoslovakiaDenmarkDominicaDominican RepublicEastern AfricaEastern AsiaEastern EuropeEcuadorEgyptEl SalvadorEnglandEritreaEthiopiaEuropeFijiFranceGermanyGhanaGreeceGrenadaGuatemalaGuyanaHaitiHondurasHong KongHungaryIndiaIndonesiaIranIraqIrelandIsraelItalyJamaicaJapanJordanKazakhstanKenyaKoreaKuwaitLaosLatin AmericaLatviaLebanonLiberiaLithuaniaMalaysiaMexicoMicronesiaMiddle AfricaMoldovaMoroccoNepalNetherlandsNicaraguaNigeriaNorth AmericaNorth MacedoniaNorthern AfricaNorthern EuropeNorwayOceaniaPakistanPanamaPeruPhilippinesPolandPortugalRomaniaRussiaSaudi ArabiaScotlandSenegalSerbiaSierra LeoneSingaporeSomaliaSouth AfricaSouth AmericaSouth Central AsiaSouth Eastern AsiaSouthern EuropeSpainSri LankaSt. Vincent and the GrenadinesSudanSwedenSwitzerlandSyriaTaiwanThailandTrinidad and TobagoTurkeyUgandaUkraineUruguayUzbekistanVenezuelaVietnamWest IndiesWestern AfricaWestern AsiaWestern EuropeYemenZaireZimbabweAzores
Polish
Race
Ancestry
AfghanAfricanAlaska NativeAlaskan AthabascanAlbanianAleutAlsatianAmericanApacheArabArapahoArgentineanArmenianAssyrian/Chaldean/SyriacAustralianAustrianBahamianBangladeshiBarbadianBasqueBelgianBelizeanBermudanBhutaneseBlackfeetBolivianBrazilianBritishBritish West IndianBulgarianBurmeseCajunCambodianCanadianCape VerdeanCarpatho RusynCelticCentral AmericanCentral American IndianCherokeeCheyenneChickasawChileanChineseChippewaChoctawColombianColvilleComancheCosta RicanCreeCreekCroatianCrowCubanCypriotCzechCzechoslovakianDanishDelawareDominicanDutchDutch West IndianEastern EuropeanEcuadorianEgyptianEnglishEstonianEthiopianEuropeanFijianFilipinoFinnishFrenchFrench American IndianFrench CanadianGermanGerman RussianGhanaianGreekGuamanian/ChamorroGuatemalanGuyaneseHaitianHmongHonduranHopiHoumaHungarianIcelanderIndian (Asian)IndonesianInupiatIranianIraqiIrishIroquoisIsraeliItalianJamaicanJapaneseJordanianKenyanKiowaKoreanLaotianLatvianLebaneseLiberianLithuanianLumbeeLuxembourgerMacedonianMalaysianMalteseMarshalleseMenomineeMexicanMexican American IndianMongolianMoroccanNative HawaiianNavajoNepaleseNew ZealanderNicaraguanNigerianNorthern EuropeanNorwegianOkinawanOsageOttawaPaiutePakistaniPalestinianPanamanianParaguayanPennsylvania GermanPeruvianPimaPolishPortuguesePotawatomiPuebloPuerto RicanPuget Sound SalishRomanianRussianSalvadoranSamoanScandinavianScotch-IrishScottishSeminoleSenegaleseSerbianShoshoneSierra LeoneanSiouxSlavicSlovakSloveneSomaliSouth AfricanSouth AmericanSouth American IndianSoviet UnionSpaniardSpanishSpanish AmericanSpanish American IndianSri LankanSubsaharan AfricanSudaneseSwedishSwissSyrianTaiwaneseThaiTlingit-HaidaTohono O'OdhamTonganTrinidadian and TobagonianTsimshianTurkishU.S. Virgin IslanderUgandanUkrainianUruguayanUteVenezuelanVietnameseWelshWest IndianYakamaYaquiYugoslavianYumanYup'ikZimbabwean
Immigration
NonimmigrantsImmigrantsAfghanistanAfricaAlbaniaArgentinaArmeniaAsiaAustraliaAustriaBahamasBangladeshBarbadosBelarusBelgiumBelizeBoliviaBosnia and HerzegovinaBrazilBulgariaBurma/MyanmarCabo VerdeCambodiaCameroonCanadaCaribbeanCentral AmericaChileChinaColombiaCongoCosta RicaCroatiaCubaCzechoslovakiaDenmarkDominicaDominican RepublicEastern AfricaEastern AsiaEastern EuropeEcuadorEgyptEl SalvadorEnglandEritreaEthiopiaEuropeFijiFranceGermanyGhanaGreeceGrenadaGuatemalaGuyanaHaitiHondurasHong KongHungaryIndiaIndonesiaIranIraqIrelandIsraelItalyJamaicaJapanJordanKazakhstanKenyaKoreaKuwaitLaosLatviaLebanonLiberiaLithuaniaMalaysiaMexicoMicronesiaMiddle AfricaMoldovaMoroccoNepalNetherlandsNicaraguaNigeriaNorth AmericaNorth MacedoniaNorthern AfricaNorthern EuropeNorwayOceaniaPakistanPanamaPeruPhilippinesPolandPortugalRomaniaRussiaSaudi ArabiaScotlandSenegalSerbiaSierra LeoneSingaporeSomaliaSouth AfricaSouth AmericaSouth Central AsiaSouth Eastern AsiaSouthern EuropeSpainSri LankaSt. Vincent and the GrenadinesSudanSwedenSwitzerlandSyriaTaiwanThailandTrinidad and TobagoTurkeyUgandaUkraineUruguayUzbekistanVenezuelaVietnamWest IndiesWestern AfricaWestern AsiaWestern EuropeYemenZaireZimbabweAzores
11th Grade
Income
Poverty
Unemployment
Labor Participation
Family Structure
Vehicle Availability
Education Level
Disability

11th Grade Comparison

Immigrants from Latin America

Poles

Tragic
Exceptional
86.8%
11TH GRADE
0.0/ 100
METRIC RATING
338th/ 347
METRIC RANK
94.8%
11TH GRADE
100.0/ 100
METRIC RATING
7th/ 347
METRIC RANK

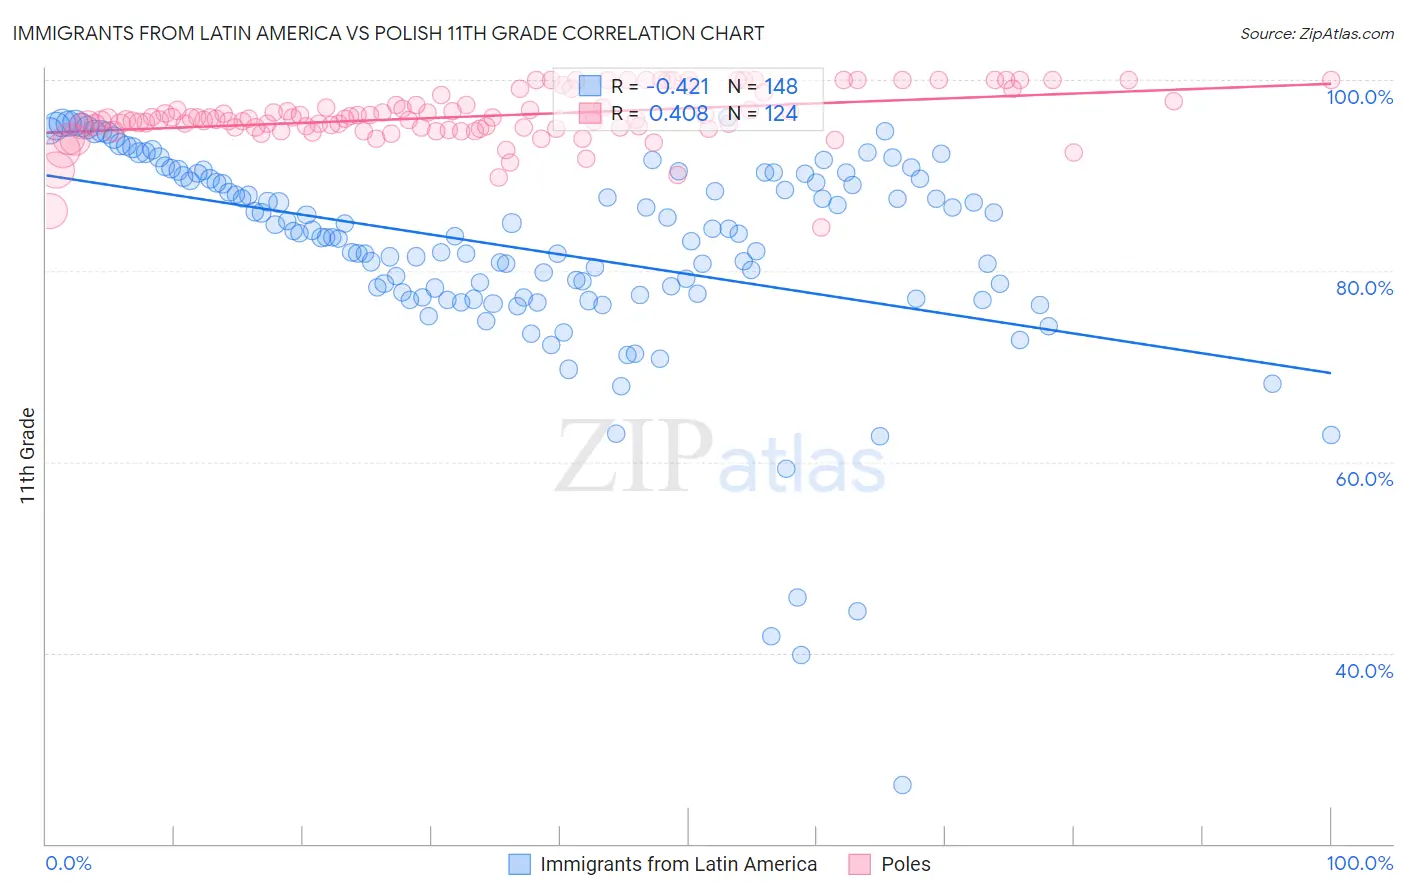
Immigrants from Latin America vs Polish 11th Grade Correlation Chart

The statistical analysis conducted on geographies consisting of 558,651,329 people shows a moderate negative correlation between the proportion of Immigrants from Latin America and percentage of population with at least 11th grade education in the United States with a correlation coefficient (R) of -0.421 and weighted average of 86.8%. Similarly, the statistical analysis conducted on geographies consisting of 560,594,575 people shows a moderate positive correlation between the proportion of Poles and percentage of population with at least 11th grade education in the United States with a correlation coefficient (R) of 0.408 and weighted average of 94.8%, a difference of 9.2%.
Immigrants from Latin America vs Polish 11th Grade

11th Grade Correlation Summary

MeasurementImmigrants from Latin AmericaPolish
Minimum26.2%84.5%
Maximum96.1%100.0%
Range69.9%15.5%
Mean82.2%96.2%
Median83.9%96.0%
Interquartile 25% (IQ1)77.5%95.0%
Interquartile 75% (IQ3)89.8%97.6%
Interquartile Range (IQR)12.3%2.6%
Standard Deviation (Sample)11.1%2.7%
Standard Deviation (Population)11.1%2.7%

Similar Demographics by 11th Grade

Demographics Similar to Immigrants from Latin America by 11th Grade

In terms of 11th grade, the demographic groups most similar to Immigrants from Latin America are Immigrants from Dominican Republic (86.9%, a difference of 0.12%), Immigrants from Honduras (86.9%, a difference of 0.12%), Central American (86.9%, a difference of 0.17%), Houma (87.0%, a difference of 0.26%), and Immigrants from Yemen (87.1%, a difference of 0.33%).
DemographicsRating | Rank11th Grade
Hispanics or Latinos
0.0
/100
|
#331
Tragic
87.3%
Immigrants | Azores
0.0
/100
|
#332
Tragic
87.2%
Immigrants | Yemen
0.0
/100
|
#333
Tragic
87.1%
Houma
0.0
/100
|
#334
Tragic
87.0%
Central Americans
0.0
/100
|
#335
Tragic
86.9%
Immigrants | Dominican Republic
0.0
/100
|
#336
Tragic
86.9%
Immigrants | Honduras
0.0
/100
|
#337
Tragic
86.9%
Immigrants | Latin America
0.0
/100
|
#338
Tragic
86.8%
Guatemalans
0.0
/100
|
#339
Tragic
86.4%
Salvadorans
0.0
/100
|
#340
Tragic
86.2%
Mexicans
0.0
/100
|
#341
Tragic
86.1%
Immigrants | Guatemala
0.0
/100
|
#342
Tragic
85.8%
Immigrants | El Salvador
0.0
/100
|
#343
Tragic
85.3%
Yakama
0.0
/100
|
#344
Tragic
85.0%
Immigrants | Central America
0.0
/100
|
#345
Tragic
84.9%

Demographics Similar to Poles by 11th Grade

In terms of 11th grade, the demographic groups most similar to Poles are Croatian (94.7%, a difference of 0.010%), Lithuanian (94.8%, a difference of 0.050%), Danish (94.7%, a difference of 0.050%), Finnish (94.7%, a difference of 0.090%), and Carpatho Rusyn (94.8%, a difference of 0.10%).
DemographicsRating | Rank11th Grade
Norwegians
100.0
/100
|
#1
Exceptional
95.2%
Swedes
100.0
/100
|
#2
Exceptional
94.9%
Slovenes
100.0
/100
|
#3
Exceptional
94.9%
Slovaks
100.0
/100
|
#4
Exceptional
94.9%
Carpatho Rusyns
100.0
/100
|
#5
Exceptional
94.8%
Lithuanians
100.0
/100
|
#6
Exceptional
94.8%
Poles
100.0
/100
|
#7
Exceptional
94.8%
Croatians
100.0
/100
|
#8
Exceptional
94.7%
Danes
100.0
/100
|
#9
Exceptional
94.7%
Finns
100.0
/100
|
#10
Exceptional
94.7%
Germans
100.0
/100
|
#11
Exceptional
94.7%
Latvians
100.0
/100
|
#12
Exceptional
94.7%
Chinese
100.0
/100
|
#13
Exceptional
94.6%
Eastern Europeans
100.0
/100
|
#14
Exceptional
94.6%
Bulgarians
100.0
/100
|
#15
Exceptional
94.5%