Immigrants from Laos vs Indian (Asian) 8th Grade
COMPARE
Immigrants from Laos
Indian (Asian)
8th Grade
8th Grade Comparison
Immigrants from Laos
Indians (Asian)
94.1%
8TH GRADE
0.0/ 100
METRIC RATING
301st/ 347
METRIC RANK
95.2%
8TH GRADE
3.3/ 100
METRIC RATING
232nd/ 347
METRIC RANK
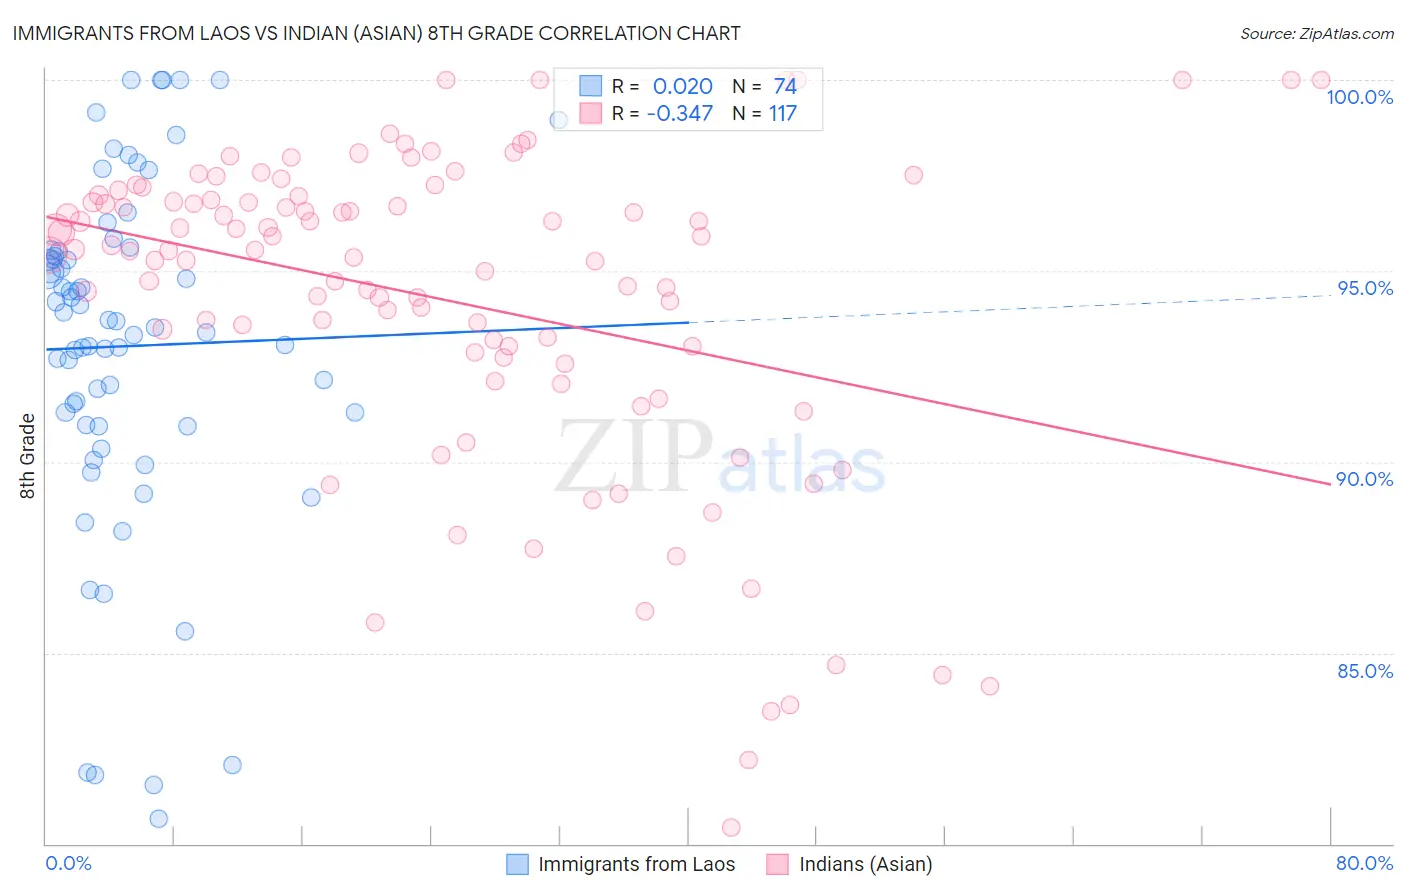
Immigrants from Laos vs Indian (Asian) 8th Grade Correlation Chart
The statistical analysis conducted on geographies consisting of 201,472,886 people shows no correlation between the proportion of Immigrants from Laos and percentage of population with at least 8th grade education in the United States with a correlation coefficient (R) of 0.020 and weighted average of 94.1%. Similarly, the statistical analysis conducted on geographies consisting of 495,348,182 people shows a mild negative correlation between the proportion of Indians (Asian) and percentage of population with at least 8th grade education in the United States with a correlation coefficient (R) of -0.347 and weighted average of 95.2%, a difference of 1.2%.
8th Grade Correlation Summary
| Measurement | Immigrants from Laos | Indian (Asian) |
| Minimum | 80.6% | 80.4% |
| Maximum | 100.0% | 100.0% |
| Range | 19.4% | 19.6% |
| Mean | 93.0% | 94.3% |
| Median | 93.6% | 95.5% |
| Interquartile 25% (IQ1) | 91.0% | 92.8% |
| Interquartile 75% (IQ3) | 95.5% | 96.9% |
| Interquartile Range (IQR) | 4.6% | 4.1% |
| Standard Deviation (Sample) | 4.5% | 4.2% |
| Standard Deviation (Population) | 4.5% | 4.2% |
Similar Demographics by 8th Grade
Demographics Similar to Immigrants from Laos by 8th Grade
In terms of 8th grade, the demographic groups most similar to Immigrants from Laos are Cuban (94.1%, a difference of 0.020%), Immigrants from Burma/Myanmar (94.1%, a difference of 0.020%), Indonesian (94.1%, a difference of 0.050%), Haitian (94.2%, a difference of 0.090%), and Immigrants from South Eastern Asia (94.2%, a difference of 0.090%).
| Demographics | Rating | Rank | 8th Grade |
| Houma | 0.0 /100 | #294 | Tragic 94.2% |
| Fijians | 0.0 /100 | #295 | Tragic 94.2% |
| Haitians | 0.0 /100 | #296 | Tragic 94.2% |
| Immigrants | South Eastern Asia | 0.0 /100 | #297 | Tragic 94.2% |
| Indonesians | 0.0 /100 | #298 | Tragic 94.1% |
| Cubans | 0.0 /100 | #299 | Tragic 94.1% |
| Immigrants | Burma/Myanmar | 0.0 /100 | #300 | Tragic 94.1% |
| Immigrants | Laos | 0.0 /100 | #301 | Tragic 94.1% |
| Sri Lankans | 0.0 /100 | #302 | Tragic 94.0% |
| Immigrants | Dominica | 0.0 /100 | #303 | Tragic 94.0% |
| Guyanese | 0.0 /100 | #304 | Tragic 93.9% |
| Immigrants | Haiti | 0.0 /100 | #305 | Tragic 93.9% |
| Immigrants | Guyana | 0.0 /100 | #306 | Tragic 93.8% |
| Immigrants | Portugal | 0.0 /100 | #307 | Tragic 93.8% |
| Ecuadorians | 0.0 /100 | #308 | Tragic 93.6% |
Demographics Similar to Indians (Asian) by 8th Grade
In terms of 8th grade, the demographic groups most similar to Indians (Asian) are Asian (95.2%, a difference of 0.010%), Immigrants from Asia (95.2%, a difference of 0.010%), Costa Rican (95.2%, a difference of 0.020%), Nigerian (95.2%, a difference of 0.020%), and Immigrants from Panama (95.2%, a difference of 0.030%).
| Demographics | Rating | Rank | 8th Grade |
| Sub-Saharan Africans | 6.0 /100 | #225 | Tragic 95.3% |
| Navajo | 5.7 /100 | #226 | Tragic 95.3% |
| Bahamians | 5.6 /100 | #227 | Tragic 95.3% |
| Immigrants | Eastern Africa | 5.6 /100 | #228 | Tragic 95.3% |
| Immigrants | Indonesia | 4.4 /100 | #229 | Tragic 95.3% |
| Immigrants | Panama | 4.1 /100 | #230 | Tragic 95.2% |
| Asians | 3.5 /100 | #231 | Tragic 95.2% |
| Indians (Asian) | 3.3 /100 | #232 | Tragic 95.2% |
| Immigrants | Asia | 3.1 /100 | #233 | Tragic 95.2% |
| Costa Ricans | 3.0 /100 | #234 | Tragic 95.2% |
| Nigerians | 2.9 /100 | #235 | Tragic 95.2% |
| Senegalese | 2.7 /100 | #236 | Tragic 95.2% |
| Immigrants | Africa | 2.7 /100 | #237 | Tragic 95.2% |
| Natives/Alaskans | 2.3 /100 | #238 | Tragic 95.2% |
| Immigrants | Sierra Leone | 2.1 /100 | #239 | Tragic 95.1% |