Immigrants from Kuwait vs Somali Associate's Degree
COMPARE
Immigrants from Kuwait
Somali
Associate's Degree
Associate's Degree Comparison
Immigrants from Kuwait
Somalis
52.4%
ASSOCIATE'S DEGREE
99.9/ 100
METRIC RATING
47th/ 347
METRIC RANK
46.8%
ASSOCIATE'S DEGREE
62.5/ 100
METRIC RATING
163rd/ 347
METRIC RANK
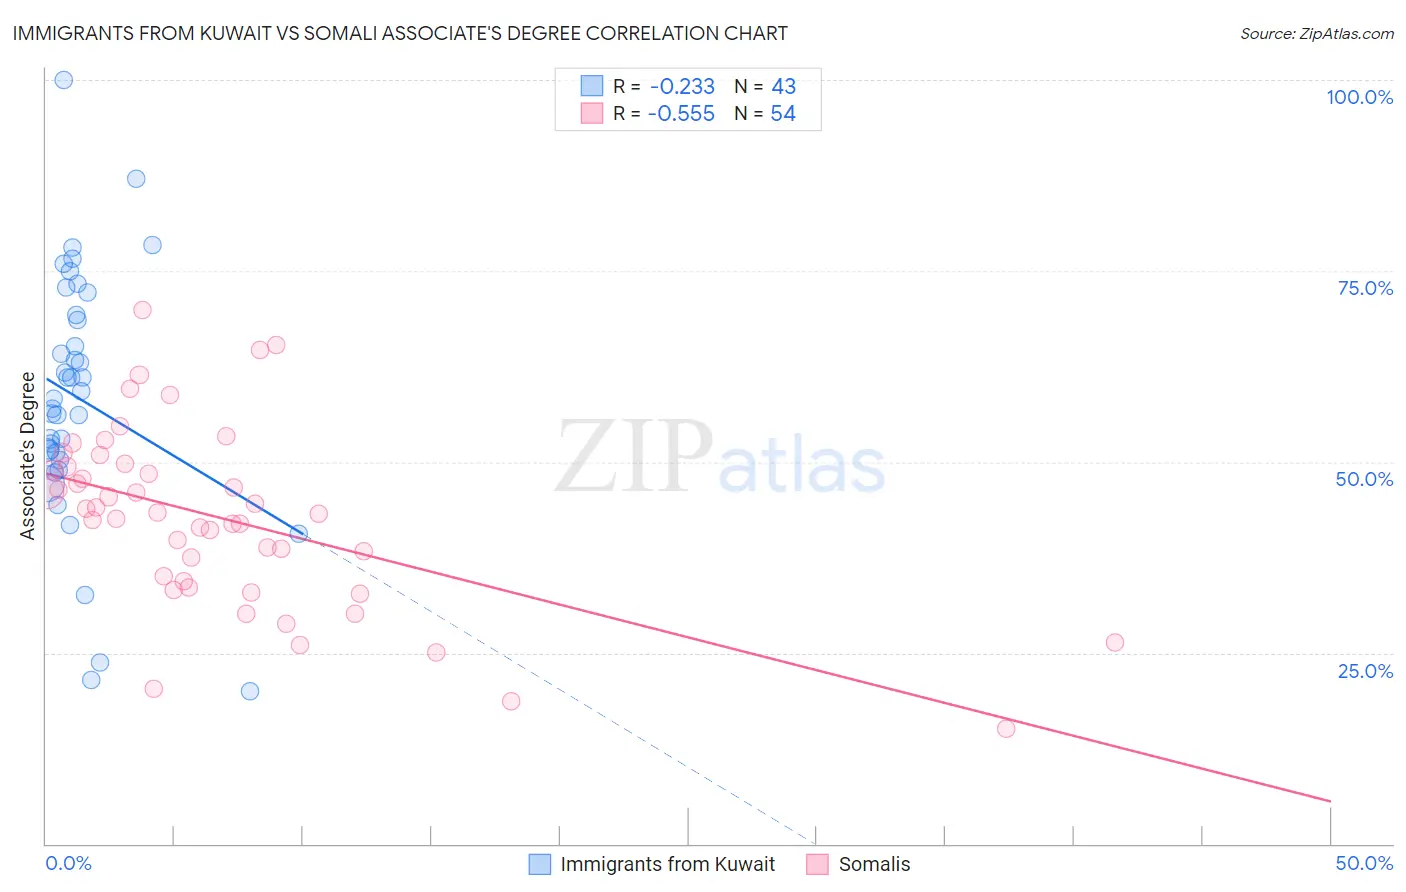
Immigrants from Kuwait vs Somali Associate's Degree Correlation Chart
The statistical analysis conducted on geographies consisting of 136,917,085 people shows a weak negative correlation between the proportion of Immigrants from Kuwait and percentage of population with at least associate's degree education in the United States with a correlation coefficient (R) of -0.233 and weighted average of 52.4%. Similarly, the statistical analysis conducted on geographies consisting of 99,330,256 people shows a substantial negative correlation between the proportion of Somalis and percentage of population with at least associate's degree education in the United States with a correlation coefficient (R) of -0.555 and weighted average of 46.8%, a difference of 11.9%.
Associate's Degree Correlation Summary
| Measurement | Immigrants from Kuwait | Somali |
| Minimum | 19.9% | 15.0% |
| Maximum | 100.0% | 69.9% |
| Range | 80.1% | 54.9% |
| Mean | 58.2% | 42.6% |
| Median | 58.2% | 43.3% |
| Interquartile 25% (IQ1) | 50.2% | 34.4% |
| Interquartile 75% (IQ3) | 69.3% | 49.4% |
| Interquartile Range (IQR) | 19.1% | 15.0% |
| Standard Deviation (Sample) | 16.5% | 11.7% |
| Standard Deviation (Population) | 16.3% | 11.6% |
Similar Demographics by Associate's Degree
Demographics Similar to Immigrants from Kuwait by Associate's Degree
In terms of associate's degree, the demographic groups most similar to Immigrants from Kuwait are Immigrants from Bulgaria (52.4%, a difference of 0.010%), Immigrants from Lithuania (52.4%, a difference of 0.14%), Estonian (52.5%, a difference of 0.22%), Immigrants from Norway (52.2%, a difference of 0.26%), and Immigrants from South Africa (52.5%, a difference of 0.31%).
| Demographics | Rating | Rank | Associate's Degree |
| Immigrants | Latvia | 99.9 /100 | #40 | Exceptional 52.8% |
| Immigrants | Saudi Arabia | 99.9 /100 | #41 | Exceptional 52.6% |
| Immigrants | Malaysia | 99.9 /100 | #42 | Exceptional 52.5% |
| Immigrants | South Africa | 99.9 /100 | #43 | Exceptional 52.5% |
| Estonians | 99.9 /100 | #44 | Exceptional 52.5% |
| Immigrants | Lithuania | 99.9 /100 | #45 | Exceptional 52.4% |
| Immigrants | Bulgaria | 99.9 /100 | #46 | Exceptional 52.4% |
| Immigrants | Kuwait | 99.9 /100 | #47 | Exceptional 52.4% |
| Immigrants | Norway | 99.9 /100 | #48 | Exceptional 52.2% |
| Immigrants | Austria | 99.9 /100 | #49 | Exceptional 52.1% |
| Asians | 99.9 /100 | #50 | Exceptional 52.1% |
| Immigrants | Greece | 99.9 /100 | #51 | Exceptional 52.1% |
| Bolivians | 99.8 /100 | #52 | Exceptional 52.0% |
| Immigrants | Asia | 99.8 /100 | #53 | Exceptional 52.0% |
| Immigrants | Spain | 99.8 /100 | #54 | Exceptional 51.9% |
Demographics Similar to Somalis by Associate's Degree
In terms of associate's degree, the demographic groups most similar to Somalis are Colombian (46.8%, a difference of 0.010%), Immigrants from Africa (46.8%, a difference of 0.060%), Immigrants from South America (46.7%, a difference of 0.21%), Scandinavian (46.9%, a difference of 0.22%), and Scottish (46.9%, a difference of 0.23%).
| Demographics | Rating | Rank | Associate's Degree |
| South Americans | 70.5 /100 | #156 | Good 47.1% |
| Sudanese | 70.3 /100 | #157 | Good 47.1% |
| Immigrants | Germany | 69.7 /100 | #158 | Good 47.1% |
| Immigrants | Poland | 69.2 /100 | #159 | Good 47.1% |
| Scottish | 65.4 /100 | #160 | Good 46.9% |
| Scandinavians | 65.2 /100 | #161 | Good 46.9% |
| Immigrants | Africa | 63.2 /100 | #162 | Good 46.8% |
| Somalis | 62.5 /100 | #163 | Good 46.8% |
| Colombians | 62.4 /100 | #164 | Good 46.8% |
| Immigrants | South America | 59.9 /100 | #165 | Average 46.7% |
| Hungarians | 59.3 /100 | #166 | Average 46.7% |
| Immigrants | Sierra Leone | 59.2 /100 | #167 | Average 46.7% |
| Immigrants | Somalia | 55.5 /100 | #168 | Average 46.5% |
| Uruguayans | 55.4 /100 | #169 | Average 46.5% |
| Irish | 53.6 /100 | #170 | Average 46.5% |