Immigrants from Kuwait vs Immigrants from the Azores 11th Grade

COMPARE

Immigrants from Kuwait
Race
Ancestry
AfghanAfricanAlaska NativeAlaskan AthabascanAlbanianAleutAlsatianAmericanApacheArabArapahoArgentineanArmenianAssyrian/Chaldean/SyriacAustralianAustrianBahamianBangladeshiBarbadianBasqueBelgianBelizeanBermudanBhutaneseBlackfeetBolivianBrazilianBritishBritish West IndianBulgarianBurmeseCajunCambodianCanadianCape VerdeanCarpatho RusynCelticCentral AmericanCentral American IndianCherokeeCheyenneChickasawChileanChineseChippewaChoctawColombianColvilleComancheCosta RicanCreeCreekCroatianCrowCubanCypriotCzechCzechoslovakianDanishDelawareDominicanDutchDutch West IndianEastern EuropeanEcuadorianEgyptianEnglishEstonianEthiopianEuropeanFijianFilipinoFinnishFrenchFrench American IndianFrench CanadianGermanGerman RussianGhanaianGreekGuamanian/ChamorroGuatemalanGuyaneseHaitianHmongHonduranHopiHoumaHungarianIcelanderIndian (Asian)IndonesianInupiatIranianIraqiIrishIroquoisIsraeliItalianJamaicanJapaneseJordanianKenyanKiowaKoreanLaotianLatvianLebaneseLiberianLithuanianLumbeeLuxembourgerMacedonianMalaysianMalteseMarshalleseMenomineeMexicanMexican American IndianMongolianMoroccanNative HawaiianNavajoNepaleseNew ZealanderNicaraguanNigerianNorthern EuropeanNorwegianOkinawanOsageOttawaPaiutePakistaniPalestinianPanamanianParaguayanPennsylvania GermanPeruvianPimaPolishPortuguesePotawatomiPuebloPuerto RicanPuget Sound SalishRomanianRussianSalvadoranSamoanScandinavianScotch-IrishScottishSeminoleSenegaleseSerbianShoshoneSierra LeoneanSiouxSlavicSlovakSloveneSomaliSouth AfricanSouth AmericanSouth American IndianSoviet UnionSpaniardSpanishSpanish AmericanSpanish American IndianSri LankanSubsaharan AfricanSudaneseSwedishSwissSyrianTaiwaneseThaiTlingit-HaidaTohono O'OdhamTonganTrinidadian and TobagonianTsimshianTurkishU.S. Virgin IslanderUgandanUkrainianUruguayanUteVenezuelanVietnameseWelshWest IndianYakamaYaquiYugoslavianYumanYup'ikZimbabwean
Immigration
NonimmigrantsImmigrantsAfghanistanAfricaAlbaniaArgentinaArmeniaAsiaAustraliaAustriaBahamasBangladeshBarbadosBelarusBelgiumBelizeBoliviaBosnia and HerzegovinaBrazilBulgariaBurma/MyanmarCabo VerdeCambodiaCameroonCanadaCaribbeanCentral AmericaChileChinaColombiaCongoCosta RicaCroatiaCubaCzechoslovakiaDenmarkDominicaDominican RepublicEastern AfricaEastern AsiaEastern EuropeEcuadorEgyptEl SalvadorEnglandEritreaEthiopiaEuropeFijiFranceGermanyGhanaGreeceGrenadaGuatemalaGuyanaHaitiHondurasHong KongHungaryIndiaIndonesiaIranIraqIrelandIsraelItalyJamaicaJapanJordanKazakhstanKenyaKoreaKuwaitLaosLatin AmericaLatviaLebanonLiberiaLithuaniaMalaysiaMexicoMicronesiaMiddle AfricaMoldovaMoroccoNepalNetherlandsNicaraguaNigeriaNorth AmericaNorth MacedoniaNorthern AfricaNorthern EuropeNorwayOceaniaPakistanPanamaPeruPhilippinesPolandPortugalRomaniaRussiaSaudi ArabiaScotlandSenegalSerbiaSierra LeoneSingaporeSomaliaSouth AfricaSouth AmericaSouth Central AsiaSouth Eastern AsiaSouthern EuropeSpainSri LankaSt. Vincent and the GrenadinesSudanSwedenSwitzerlandSyriaTaiwanThailandTrinidad and TobagoTurkeyUgandaUkraineUruguayUzbekistanVenezuelaVietnamWest IndiesWestern AfricaWestern AsiaWestern EuropeYemenZaireZimbabwe
Immigrants from the Azores
Race
Ancestry
AfghanAfricanAlaska NativeAlaskan AthabascanAlbanianAleutAlsatianAmericanApacheArabArapahoArgentineanArmenianAssyrian/Chaldean/SyriacAustralianAustrianBahamianBangladeshiBarbadianBasqueBelgianBelizeanBermudanBhutaneseBlackfeetBolivianBrazilianBritishBritish West IndianBulgarianBurmeseCajunCambodianCanadianCape VerdeanCarpatho RusynCelticCentral AmericanCentral American IndianCherokeeCheyenneChickasawChileanChineseChippewaChoctawColombianColvilleComancheCosta RicanCreeCreekCroatianCrowCubanCypriotCzechCzechoslovakianDanishDelawareDominicanDutchDutch West IndianEastern EuropeanEcuadorianEgyptianEnglishEstonianEthiopianEuropeanFijianFilipinoFinnishFrenchFrench American IndianFrench CanadianGermanGerman RussianGhanaianGreekGuamanian/ChamorroGuatemalanGuyaneseHaitianHmongHonduranHopiHoumaHungarianIcelanderIndian (Asian)IndonesianInupiatIranianIraqiIrishIroquoisIsraeliItalianJamaicanJapaneseJordanianKenyanKiowaKoreanLaotianLatvianLebaneseLiberianLithuanianLumbeeLuxembourgerMacedonianMalaysianMalteseMarshalleseMenomineeMexicanMexican American IndianMongolianMoroccanNative HawaiianNavajoNepaleseNew ZealanderNicaraguanNigerianNorthern EuropeanNorwegianOkinawanOsageOttawaPaiutePakistaniPalestinianPanamanianParaguayanPennsylvania GermanPeruvianPimaPolishPortuguesePotawatomiPuebloPuerto RicanPuget Sound SalishRomanianRussianSalvadoranSamoanScandinavianScotch-IrishScottishSeminoleSenegaleseSerbianShoshoneSierra LeoneanSiouxSlavicSlovakSloveneSomaliSouth AfricanSouth AmericanSouth American IndianSoviet UnionSpaniardSpanishSpanish AmericanSpanish American IndianSri LankanSubsaharan AfricanSudaneseSwedishSwissSyrianTaiwaneseThaiTlingit-HaidaTohono O'OdhamTonganTrinidadian and TobagonianTsimshianTurkishU.S. Virgin IslanderUgandanUkrainianUruguayanUteVenezuelanVietnameseWelshWest IndianYakamaYaquiYugoslavianYumanYup'ikZimbabwean
Immigration
NonimmigrantsImmigrantsAfghanistanAfricaAlbaniaArgentinaArmeniaAsiaAustraliaAustriaBahamasBangladeshBarbadosBelarusBelgiumBelizeBoliviaBosnia and HerzegovinaBrazilBulgariaBurma/MyanmarCabo VerdeCambodiaCameroonCanadaCaribbeanCentral AmericaChileChinaColombiaCongoCosta RicaCroatiaCubaCzechoslovakiaDenmarkDominicaDominican RepublicEastern AfricaEastern AsiaEastern EuropeEcuadorEgyptEl SalvadorEnglandEritreaEthiopiaEuropeFijiFranceGermanyGhanaGreeceGrenadaGuatemalaGuyanaHaitiHondurasHong KongHungaryIndiaIndonesiaIranIraqIrelandIsraelItalyJamaicaJapanJordanKazakhstanKenyaKoreaLaosLatin AmericaLatviaLebanonLiberiaLithuaniaMalaysiaMexicoMicronesiaMiddle AfricaMoldovaMoroccoNepalNetherlandsNicaraguaNigeriaNorth AmericaNorth MacedoniaNorthern AfricaNorthern EuropeNorwayOceaniaPakistanPanamaPeruPhilippinesPolandPortugalRomaniaRussiaSaudi ArabiaScotlandSenegalSerbiaSierra LeoneSingaporeSomaliaSouth AfricaSouth AmericaSouth Central AsiaSouth Eastern AsiaSouthern EuropeSpainSri LankaSt. Vincent and the GrenadinesSudanSwedenSwitzerlandSyriaTaiwanThailandTrinidad and TobagoTurkeyUgandaUkraineUruguayUzbekistanVenezuelaVietnamWest IndiesWestern AfricaWestern AsiaWestern EuropeYemenZaireZimbabweAzores
11th Grade
Income
Poverty
Unemployment
Labor Participation
Family Structure
Vehicle Availability
Education Level
Disability

11th Grade Comparison

Immigrants from Kuwait

Immigrants from the Azores

Exceptional
Tragic
93.5%
11TH GRADE
98.4/ 100
METRIC RATING
109th/ 347
METRIC RANK
87.2%
11TH GRADE
0.0/ 100
METRIC RATING
332nd/ 347
METRIC RANK

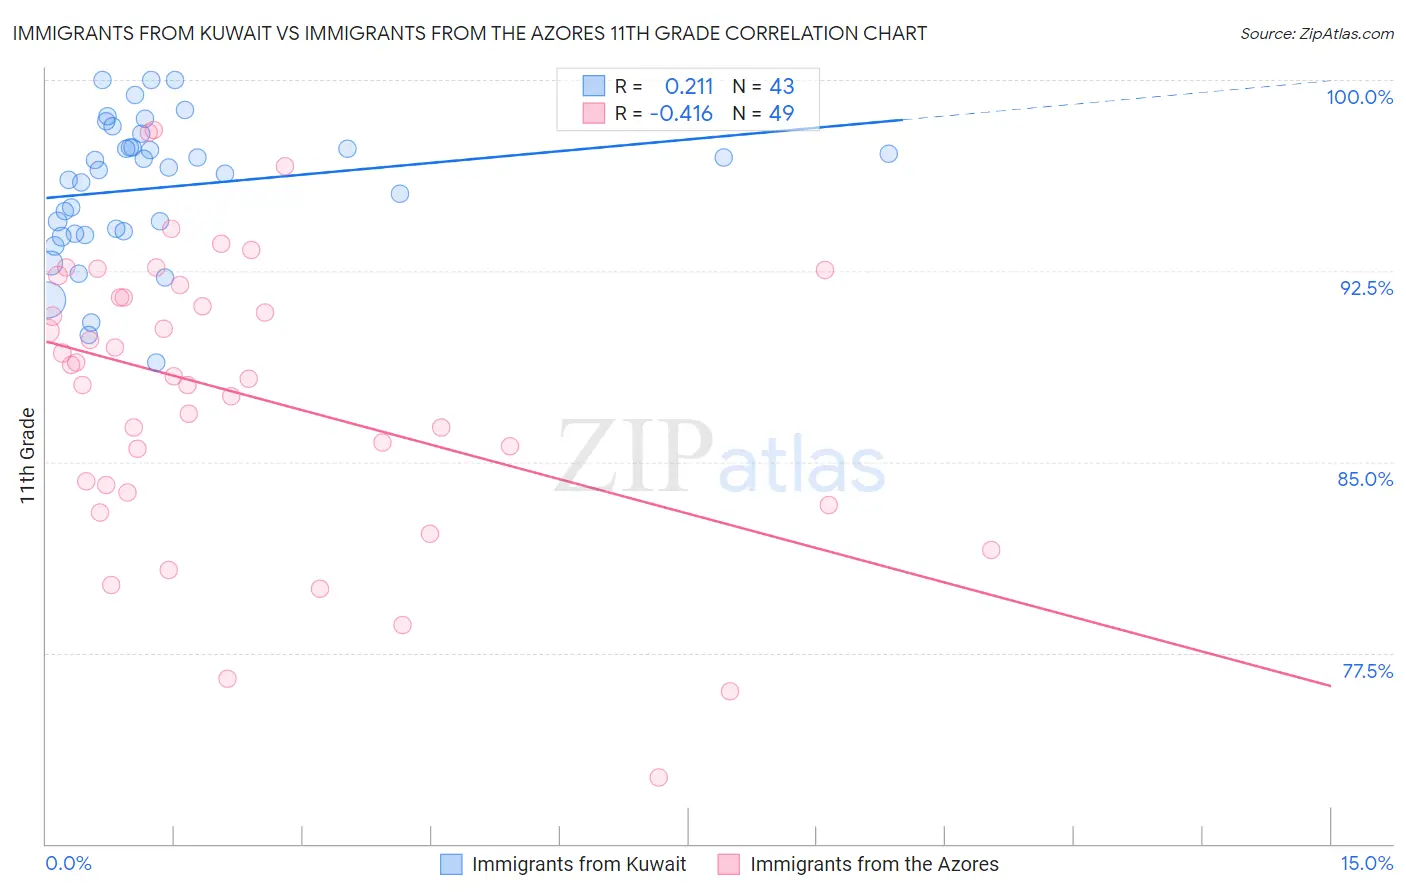
Immigrants from Kuwait vs Immigrants from the Azores 11th Grade Correlation Chart

The statistical analysis conducted on geographies consisting of 136,917,085 people shows a weak positive correlation between the proportion of Immigrants from Kuwait and percentage of population with at least 11th grade education in the United States with a correlation coefficient (R) of 0.211 and weighted average of 93.5%. Similarly, the statistical analysis conducted on geographies consisting of 46,257,310 people shows a moderate negative correlation between the proportion of Immigrants from the Azores and percentage of population with at least 11th grade education in the United States with a correlation coefficient (R) of -0.416 and weighted average of 87.2%, a difference of 7.1%.
Immigrants from Kuwait vs Immigrants from the Azores 11th Grade

11th Grade Correlation Summary

MeasurementImmigrants from KuwaitImmigrants from the Azores
Minimum88.9%72.6%
Maximum100.0%98.0%
Range11.1%25.4%
Mean95.8%87.6%
Median96.5%88.3%
Interquartile 25% (IQ1)94.0%83.9%
Interquartile 75% (IQ3)97.4%91.7%
Interquartile Range (IQR)3.4%7.8%
Standard Deviation (Sample)2.7%5.6%
Standard Deviation (Population)2.7%5.6%

Similar Demographics by 11th Grade

Demographics Similar to Immigrants from Kuwait by 11th Grade

In terms of 11th grade, the demographic groups most similar to Immigrants from Kuwait are Alaska Native (93.5%, a difference of 0.0%), Immigrants from Norway (93.5%, a difference of 0.010%), Syrian (93.4%, a difference of 0.010%), Chippewa (93.5%, a difference of 0.030%), and Lebanese (93.5%, a difference of 0.030%).
DemographicsRating | Rank11th Grade
Chippewa
98.6
/100
|
#102
Exceptional
93.5%
Lebanese
98.6
/100
|
#103
Exceptional
93.5%
Immigrants | Europe
98.6
/100
|
#104
Exceptional
93.5%
Immigrants | Serbia
98.6
/100
|
#105
Exceptional
93.5%
Immigrants | Croatia
98.6
/100
|
#106
Exceptional
93.5%
Immigrants | Norway
98.4
/100
|
#107
Exceptional
93.5%
Alaska Natives
98.4
/100
|
#108
Exceptional
93.5%
Immigrants | Kuwait
98.4
/100
|
#109
Exceptional
93.5%
Syrians
98.4
/100
|
#110
Exceptional
93.4%
Yugoslavians
98.1
/100
|
#111
Exceptional
93.4%
Immigrants | Germany
98.0
/100
|
#112
Exceptional
93.4%
Immigrants | Zimbabwe
97.8
/100
|
#113
Exceptional
93.4%
Jordanians
97.8
/100
|
#114
Exceptional
93.4%
Palestinians
97.7
/100
|
#115
Exceptional
93.4%
Immigrants | Hungary
97.5
/100
|
#116
Exceptional
93.4%

Demographics Similar to Immigrants from the Azores by 11th Grade

In terms of 11th grade, the demographic groups most similar to Immigrants from the Azores are Hispanic or Latino (87.3%, a difference of 0.090%), Honduran (87.4%, a difference of 0.16%), Immigrants from Yemen (87.1%, a difference of 0.17%), Houma (87.0%, a difference of 0.24%), and Central American (86.9%, a difference of 0.33%).
DemographicsRating | Rank11th Grade
Immigrants | Nicaragua
0.0
/100
|
#325
Tragic
88.1%
Dominicans
0.0
/100
|
#326
Tragic
87.7%
Immigrants | Cabo Verde
0.0
/100
|
#327
Tragic
87.6%
Tohono O'odham
0.0
/100
|
#328
Tragic
87.6%
Mexican American Indians
0.0
/100
|
#329
Tragic
87.5%
Hondurans
0.0
/100
|
#330
Tragic
87.4%
Hispanics or Latinos
0.0
/100
|
#331
Tragic
87.3%
Immigrants | Azores
0.0
/100
|
#332
Tragic
87.2%
Immigrants | Yemen
0.0
/100
|
#333
Tragic
87.1%
Houma
0.0
/100
|
#334
Tragic
87.0%
Central Americans
0.0
/100
|
#335
Tragic
86.9%
Immigrants | Dominican Republic
0.0
/100
|
#336
Tragic
86.9%
Immigrants | Honduras
0.0
/100
|
#337
Tragic
86.9%
Immigrants | Latin America
0.0
/100
|
#338
Tragic
86.8%
Guatemalans
0.0
/100
|
#339
Tragic
86.4%