Immigrants from Korea vs Yugoslavian 1st Grade

COMPARE

Immigrants from Korea
Race
Ancestry
AfghanAfricanAlaska NativeAlaskan AthabascanAlbanianAleutAlsatianAmericanApacheArabArapahoArgentineanArmenianAssyrian/Chaldean/SyriacAustralianAustrianBahamianBangladeshiBarbadianBasqueBelgianBelizeanBermudanBhutaneseBlackfeetBolivianBrazilianBritishBritish West IndianBulgarianBurmeseCajunCambodianCanadianCape VerdeanCarpatho RusynCelticCentral AmericanCentral American IndianCherokeeCheyenneChickasawChileanChineseChippewaChoctawColombianColvilleComancheCosta RicanCreeCreekCroatianCrowCubanCypriotCzechCzechoslovakianDanishDelawareDominicanDutchDutch West IndianEastern EuropeanEcuadorianEgyptianEnglishEstonianEthiopianEuropeanFijianFilipinoFinnishFrenchFrench American IndianFrench CanadianGermanGerman RussianGhanaianGreekGuamanian/ChamorroGuatemalanGuyaneseHaitianHmongHonduranHopiHoumaHungarianIcelanderIndian (Asian)IndonesianInupiatIranianIraqiIrishIroquoisIsraeliItalianJamaicanJapaneseJordanianKenyanKiowaKoreanLaotianLatvianLebaneseLiberianLithuanianLumbeeLuxembourgerMacedonianMalaysianMalteseMarshalleseMenomineeMexicanMexican American IndianMongolianMoroccanNative HawaiianNavajoNepaleseNew ZealanderNicaraguanNigerianNorthern EuropeanNorwegianOkinawanOsageOttawaPaiutePakistaniPalestinianPanamanianParaguayanPennsylvania GermanPeruvianPimaPolishPortuguesePotawatomiPuebloPuerto RicanPuget Sound SalishRomanianRussianSalvadoranSamoanScandinavianScotch-IrishScottishSeminoleSenegaleseSerbianShoshoneSierra LeoneanSiouxSlavicSlovakSloveneSomaliSouth AfricanSouth AmericanSouth American IndianSoviet UnionSpaniardSpanishSpanish AmericanSpanish American IndianSri LankanSubsaharan AfricanSudaneseSwedishSwissSyrianTaiwaneseThaiTlingit-HaidaTohono O'OdhamTonganTrinidadian and TobagonianTsimshianTurkishU.S. Virgin IslanderUgandanUkrainianUruguayanUteVenezuelanVietnameseWelshWest IndianYakamaYaquiYumanYup'ikZimbabwean
Immigration
NonimmigrantsImmigrantsAfghanistanAfricaAlbaniaArgentinaArmeniaAsiaAustraliaAustriaBahamasBangladeshBarbadosBelarusBelgiumBelizeBoliviaBosnia and HerzegovinaBrazilBulgariaBurma/MyanmarCabo VerdeCambodiaCameroonCanadaCaribbeanCentral AmericaChileChinaColombiaCongoCosta RicaCroatiaCubaCzechoslovakiaDenmarkDominicaDominican RepublicEastern AfricaEastern AsiaEastern EuropeEcuadorEgyptEl SalvadorEnglandEritreaEthiopiaEuropeFijiFranceGermanyGhanaGreeceGrenadaGuatemalaGuyanaHaitiHondurasHong KongHungaryIndiaIndonesiaIranIraqIrelandIsraelItalyJamaicaJapanJordanKazakhstanKenyaKoreaKuwaitLaosLatin AmericaLatviaLebanonLiberiaLithuaniaMalaysiaMexicoMicronesiaMiddle AfricaMoldovaMoroccoNepalNetherlandsNicaraguaNigeriaNorth AmericaNorth MacedoniaNorthern AfricaNorthern EuropeNorwayOceaniaPakistanPanamaPeruPhilippinesPolandPortugalRomaniaRussiaSaudi ArabiaScotlandSenegalSerbiaSierra LeoneSingaporeSomaliaSouth AfricaSouth AmericaSouth Central AsiaSouth Eastern AsiaSouthern EuropeSpainSri LankaSt. Vincent and the GrenadinesSudanSwedenSwitzerlandSyriaTaiwanThailandTrinidad and TobagoTurkeyUgandaUkraineUruguayUzbekistanVenezuelaVietnamWest IndiesWestern AfricaWestern AsiaWestern EuropeYemenZaireZimbabweAzores
Yugoslavian
Race
Ancestry
AfghanAfricanAlaska NativeAlaskan AthabascanAlbanianAleutAlsatianAmericanApacheArabArapahoArgentineanArmenianAssyrian/Chaldean/SyriacAustralianAustrianBahamianBangladeshiBarbadianBasqueBelgianBelizeanBermudanBhutaneseBlackfeetBolivianBrazilianBritishBritish West IndianBulgarianBurmeseCajunCambodianCanadianCape VerdeanCarpatho RusynCelticCentral AmericanCentral American IndianCherokeeCheyenneChickasawChileanChineseChippewaChoctawColombianColvilleComancheCosta RicanCreeCreekCroatianCrowCubanCypriotCzechCzechoslovakianDanishDelawareDominicanDutchDutch West IndianEastern EuropeanEcuadorianEgyptianEnglishEstonianEthiopianEuropeanFijianFilipinoFinnishFrenchFrench American IndianFrench CanadianGermanGerman RussianGhanaianGreekGuamanian/ChamorroGuatemalanGuyaneseHaitianHmongHonduranHopiHoumaHungarianIcelanderIndian (Asian)IndonesianInupiatIranianIraqiIrishIroquoisIsraeliItalianJamaicanJapaneseJordanianKenyanKiowaKoreanLaotianLatvianLebaneseLiberianLithuanianLumbeeLuxembourgerMacedonianMalaysianMalteseMarshalleseMenomineeMexicanMexican American IndianMongolianMoroccanNative HawaiianNavajoNepaleseNew ZealanderNicaraguanNigerianNorthern EuropeanNorwegianOkinawanOsageOttawaPaiutePakistaniPalestinianPanamanianParaguayanPennsylvania GermanPeruvianPimaPolishPortuguesePotawatomiPuebloPuerto RicanPuget Sound SalishRomanianRussianSalvadoranSamoanScandinavianScotch-IrishScottishSeminoleSenegaleseSerbianShoshoneSierra LeoneanSiouxSlavicSlovakSloveneSomaliSouth AfricanSouth AmericanSouth American IndianSoviet UnionSpaniardSpanishSpanish AmericanSpanish American IndianSri LankanSubsaharan AfricanSudaneseSwedishSwissSyrianTaiwaneseThaiTlingit-HaidaTohono O'OdhamTonganTrinidadian and TobagonianTsimshianTurkishU.S. Virgin IslanderUgandanUkrainianUruguayanUteVenezuelanVietnameseWelshWest IndianYakamaYaquiYugoslavianYumanYup'ikZimbabwean
Immigration
NonimmigrantsImmigrantsAfghanistanAfricaAlbaniaArgentinaArmeniaAsiaAustraliaAustriaBahamasBangladeshBarbadosBelarusBelgiumBelizeBoliviaBosnia and HerzegovinaBrazilBulgariaBurma/MyanmarCabo VerdeCambodiaCameroonCanadaCaribbeanCentral AmericaChileChinaColombiaCongoCosta RicaCroatiaCubaCzechoslovakiaDenmarkDominicaDominican RepublicEastern AfricaEastern AsiaEastern EuropeEcuadorEgyptEl SalvadorEnglandEritreaEthiopiaEuropeFijiFranceGermanyGhanaGreeceGrenadaGuatemalaGuyanaHaitiHondurasHong KongHungaryIndiaIndonesiaIranIraqIrelandIsraelItalyJamaicaJapanJordanKazakhstanKenyaKuwaitLaosLatin AmericaLatviaLebanonLiberiaLithuaniaMalaysiaMexicoMicronesiaMiddle AfricaMoldovaMoroccoNepalNetherlandsNicaraguaNigeriaNorth AmericaNorth MacedoniaNorthern AfricaNorthern EuropeNorwayOceaniaPakistanPanamaPeruPhilippinesPolandPortugalRomaniaRussiaSaudi ArabiaScotlandSenegalSerbiaSierra LeoneSingaporeSomaliaSouth AfricaSouth AmericaSouth Central AsiaSouth Eastern AsiaSouthern EuropeSpainSri LankaSt. Vincent and the GrenadinesSudanSwedenSwitzerlandSyriaTaiwanThailandTrinidad and TobagoTurkeyUgandaUkraineUruguayUzbekistanVenezuelaVietnamWest IndiesWestern AfricaWestern AsiaWestern EuropeYemenZaireZimbabweAzores
1st Grade
Income
Poverty
Unemployment
Labor Participation
Family Structure
Vehicle Availability
Education Level
Disability

1st Grade Comparison

Immigrants from Korea

Yugoslavians

Average
Exceptional
97.9%
1ST GRADE
53.0/ 100
METRIC RATING
172nd/ 347
METRIC RANK
98.2%
1ST GRADE
95.5/ 100
METRIC RATING
117th/ 347
METRIC RANK

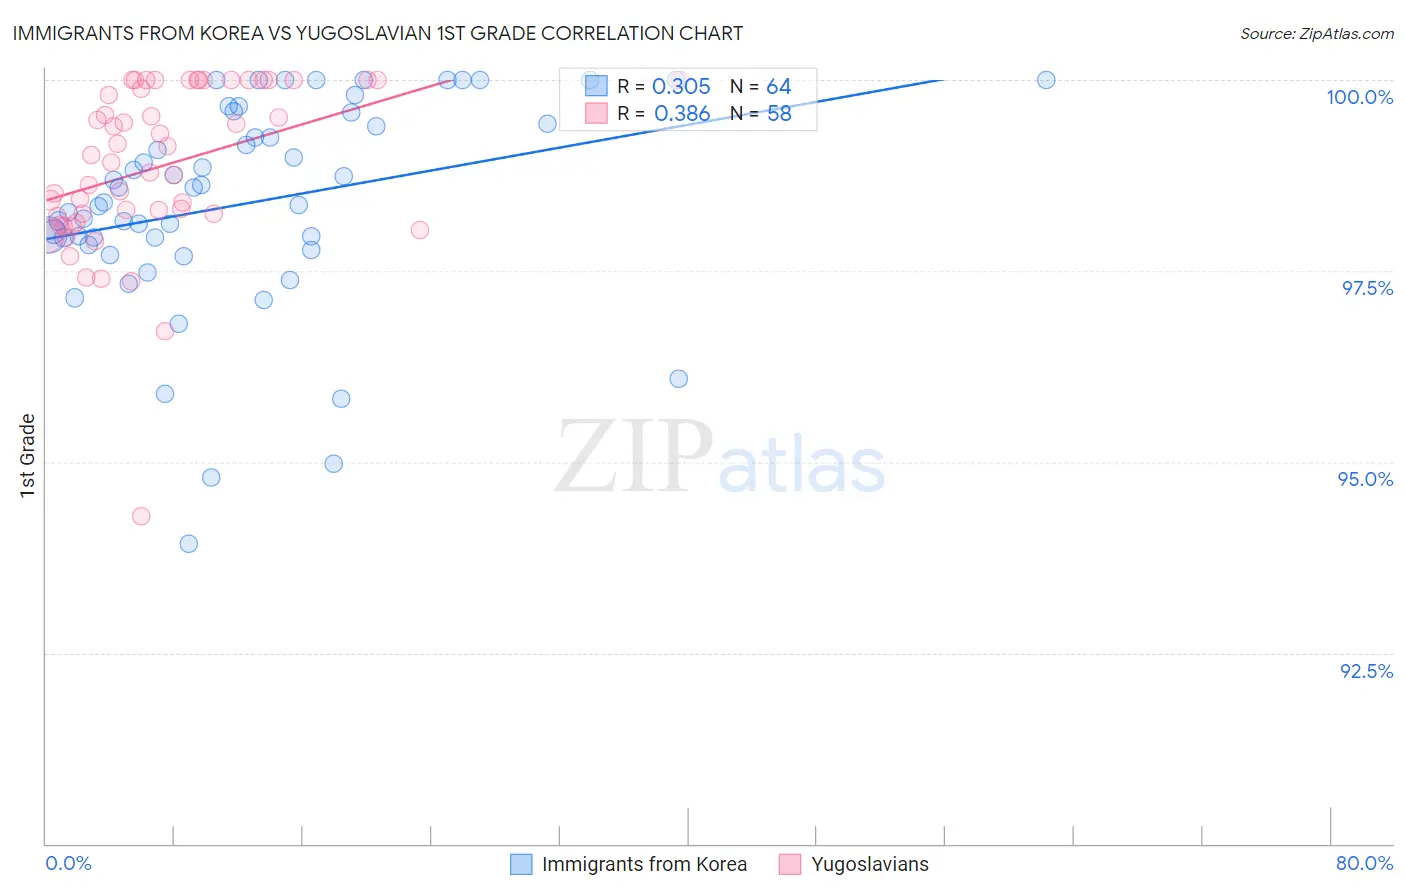
Immigrants from Korea vs Yugoslavian 1st Grade Correlation Chart

The statistical analysis conducted on geographies consisting of 416,280,076 people shows a mild positive correlation between the proportion of Immigrants from Korea and percentage of population with at least 1st grade education in the United States with a correlation coefficient (R) of 0.305 and weighted average of 97.9%. Similarly, the statistical analysis conducted on geographies consisting of 285,681,276 people shows a mild positive correlation between the proportion of Yugoslavians and percentage of population with at least 1st grade education in the United States with a correlation coefficient (R) of 0.386 and weighted average of 98.2%, a difference of 0.23%.
Immigrants from Korea vs Yugoslavian 1st Grade

1st Grade Correlation Summary

MeasurementImmigrants from KoreaYugoslavian
Minimum93.9%94.3%
Maximum100.0%100.0%
Range6.1%5.7%
Mean98.4%98.9%
Median98.5%99.0%
Interquartile 25% (IQ1)97.9%98.2%
Interquartile 75% (IQ3)99.5%100.0%
Interquartile Range (IQR)1.6%1.8%
Standard Deviation (Sample)1.4%1.1%
Standard Deviation (Population)1.4%1.1%

Similar Demographics by 1st Grade

Demographics Similar to Immigrants from Korea by 1st Grade

In terms of 1st grade, the demographic groups most similar to Immigrants from Korea are Immigrants from Jordan (97.9%, a difference of 0.0%), Ugandan (97.9%, a difference of 0.010%), Navajo (97.9%, a difference of 0.010%), Bermudan (97.9%, a difference of 0.010%), and Chilean (97.9%, a difference of 0.010%).
DemographicsRating | Rank1st Grade
Ugandans
56.9
/100
|
#165
Average
97.9%
Navajo
56.6
/100
|
#166
Average
97.9%
Bermudans
56.3
/100
|
#167
Average
97.9%
Chileans
55.6
/100
|
#168
Average
97.9%
Immigrants | Micronesia
55.3
/100
|
#169
Average
97.9%
Immigrants | Spain
54.9
/100
|
#170
Average
97.9%
Immigrants | Jordan
53.9
/100
|
#171
Average
97.9%
Immigrants | Korea
53.0
/100
|
#172
Average
97.9%
Kenyans
51.2
/100
|
#173
Average
97.9%
Natives/Alaskans
50.0
/100
|
#174
Average
97.9%
Immigrants | Sri Lanka
49.7
/100
|
#175
Average
97.9%
Albanians
49.6
/100
|
#176
Average
97.9%
Immigrants | Brazil
49.1
/100
|
#177
Average
97.9%
Immigrants | Venezuela
47.8
/100
|
#178
Average
97.9%
Argentineans
47.2
/100
|
#179
Average
97.9%

Demographics Similar to Yugoslavians by 1st Grade

In terms of 1st grade, the demographic groups most similar to Yugoslavians are Immigrants from France (98.2%, a difference of 0.0%), Ute (98.2%, a difference of 0.010%), Iranian (98.2%, a difference of 0.010%), Spanish (98.2%, a difference of 0.010%), and Thai (98.1%, a difference of 0.010%).
DemographicsRating | Rank1st Grade
Immigrants | Singapore
96.7
/100
|
#110
Exceptional
98.2%
Immigrants | Czechoslovakia
96.6
/100
|
#111
Exceptional
98.2%
Immigrants | Norway
96.6
/100
|
#112
Exceptional
98.2%
Immigrants | Latvia
96.4
/100
|
#113
Exceptional
98.2%
Ute
96.2
/100
|
#114
Exceptional
98.2%
Iranians
96.0
/100
|
#115
Exceptional
98.2%
Spanish
95.9
/100
|
#116
Exceptional
98.2%
Yugoslavians
95.5
/100
|
#117
Exceptional
98.2%
Immigrants | France
95.5
/100
|
#118
Exceptional
98.2%
Thais
94.7
/100
|
#119
Exceptional
98.1%
Okinawans
94.5
/100
|
#120
Exceptional
98.1%
Immigrants | Zimbabwe
94.0
/100
|
#121
Exceptional
98.1%
Menominee
93.9
/100
|
#122
Exceptional
98.1%
Iroquois
93.8
/100
|
#123
Exceptional
98.1%
Syrians
93.7
/100
|
#124
Exceptional
98.1%