Immigrants from Kenya vs Immigrants from Barbados 3rd Grade

COMPARE

Immigrants from Kenya
Race
Ancestry
AfghanAfricanAlaska NativeAlaskan AthabascanAlbanianAleutAlsatianAmericanApacheArabArapahoArgentineanArmenianAssyrian/Chaldean/SyriacAustralianAustrianBahamianBangladeshiBarbadianBasqueBelgianBelizeanBermudanBhutaneseBlackfeetBolivianBrazilianBritishBritish West IndianBulgarianBurmeseCajunCambodianCanadianCape VerdeanCarpatho RusynCelticCentral AmericanCentral American IndianCherokeeCheyenneChickasawChileanChineseChippewaChoctawColombianColvilleComancheCosta RicanCreeCreekCroatianCrowCubanCypriotCzechCzechoslovakianDanishDelawareDominicanDutchDutch West IndianEastern EuropeanEcuadorianEgyptianEnglishEstonianEthiopianEuropeanFijianFilipinoFinnishFrenchFrench American IndianFrench CanadianGermanGerman RussianGhanaianGreekGuamanian/ChamorroGuatemalanGuyaneseHaitianHmongHonduranHopiHoumaHungarianIcelanderIndian (Asian)IndonesianInupiatIranianIraqiIrishIroquoisIsraeliItalianJamaicanJapaneseJordanianKenyanKiowaKoreanLaotianLatvianLebaneseLiberianLithuanianLumbeeLuxembourgerMacedonianMalaysianMalteseMarshalleseMenomineeMexicanMexican American IndianMongolianMoroccanNative HawaiianNavajoNepaleseNew ZealanderNicaraguanNigerianNorthern EuropeanNorwegianOkinawanOsageOttawaPaiutePakistaniPalestinianPanamanianParaguayanPennsylvania GermanPeruvianPimaPolishPortuguesePotawatomiPuebloPuerto RicanPuget Sound SalishRomanianRussianSalvadoranSamoanScandinavianScotch-IrishScottishSeminoleSenegaleseSerbianShoshoneSierra LeoneanSiouxSlavicSlovakSloveneSomaliSouth AfricanSouth AmericanSouth American IndianSoviet UnionSpaniardSpanishSpanish AmericanSpanish American IndianSri LankanSubsaharan AfricanSudaneseSwedishSwissSyrianTaiwaneseThaiTlingit-HaidaTohono O'OdhamTonganTrinidadian and TobagonianTsimshianTurkishU.S. Virgin IslanderUgandanUkrainianUruguayanUteVenezuelanVietnameseWelshWest IndianYakamaYaquiYugoslavianYumanYup'ikZimbabwean
Immigration
NonimmigrantsImmigrantsAfghanistanAfricaAlbaniaArgentinaArmeniaAsiaAustraliaAustriaBahamasBangladeshBelarusBelgiumBelizeBoliviaBosnia and HerzegovinaBrazilBulgariaBurma/MyanmarCabo VerdeCambodiaCameroonCanadaCaribbeanCentral AmericaChileChinaColombiaCongoCosta RicaCroatiaCubaCzechoslovakiaDenmarkDominicaDominican RepublicEastern AfricaEastern AsiaEastern EuropeEcuadorEgyptEl SalvadorEnglandEritreaEthiopiaEuropeFijiFranceGermanyGhanaGreeceGrenadaGuatemalaGuyanaHaitiHondurasHong KongHungaryIndiaIndonesiaIranIraqIrelandIsraelItalyJamaicaJapanJordanKazakhstanKenyaKoreaKuwaitLaosLatin AmericaLatviaLebanonLiberiaLithuaniaMalaysiaMexicoMicronesiaMiddle AfricaMoldovaMoroccoNepalNetherlandsNicaraguaNigeriaNorth AmericaNorth MacedoniaNorthern AfricaNorthern EuropeNorwayOceaniaPakistanPanamaPeruPhilippinesPolandPortugalRomaniaRussiaSaudi ArabiaScotlandSenegalSerbiaSierra LeoneSingaporeSomaliaSouth AfricaSouth AmericaSouth Central AsiaSouth Eastern AsiaSouthern EuropeSpainSri LankaSt. Vincent and the GrenadinesSudanSwedenSwitzerlandSyriaTaiwanThailandTrinidad and TobagoTurkeyUgandaUkraineUruguayUzbekistanVenezuelaVietnamWest IndiesWestern AfricaWestern AsiaWestern EuropeYemenZaireZimbabweAzores
Immigrants from Barbados
Race
Ancestry
AfghanAfricanAlaska NativeAlaskan AthabascanAlbanianAleutAlsatianAmericanApacheArabArapahoArgentineanArmenianAssyrian/Chaldean/SyriacAustralianAustrianBahamianBangladeshiBarbadianBasqueBelgianBelizeanBermudanBhutaneseBlackfeetBolivianBrazilianBritishBritish West IndianBulgarianBurmeseCajunCambodianCanadianCape VerdeanCarpatho RusynCelticCentral AmericanCentral American IndianCherokeeCheyenneChickasawChileanChineseChippewaChoctawColombianColvilleComancheCosta RicanCreeCreekCroatianCrowCubanCypriotCzechCzechoslovakianDanishDelawareDominicanDutchDutch West IndianEastern EuropeanEcuadorianEgyptianEnglishEstonianEthiopianEuropeanFijianFilipinoFinnishFrenchFrench American IndianFrench CanadianGermanGerman RussianGhanaianGreekGuamanian/ChamorroGuatemalanGuyaneseHaitianHmongHonduranHopiHoumaHungarianIcelanderIndian (Asian)IndonesianInupiatIranianIraqiIrishIroquoisIsraeliItalianJamaicanJapaneseJordanianKenyanKiowaKoreanLaotianLatvianLebaneseLiberianLithuanianLumbeeLuxembourgerMacedonianMalaysianMalteseMarshalleseMenomineeMexicanMexican American IndianMongolianMoroccanNative HawaiianNavajoNepaleseNew ZealanderNicaraguanNigerianNorthern EuropeanNorwegianOkinawanOsageOttawaPaiutePakistaniPalestinianPanamanianParaguayanPennsylvania GermanPeruvianPimaPolishPortuguesePotawatomiPuebloPuerto RicanPuget Sound SalishRomanianRussianSalvadoranSamoanScandinavianScotch-IrishScottishSeminoleSenegaleseSerbianShoshoneSierra LeoneanSiouxSlavicSlovakSloveneSomaliSouth AfricanSouth AmericanSouth American IndianSoviet UnionSpaniardSpanishSpanish AmericanSpanish American IndianSri LankanSubsaharan AfricanSudaneseSwedishSwissSyrianTaiwaneseThaiTlingit-HaidaTohono O'OdhamTonganTrinidadian and TobagonianTsimshianTurkishU.S. Virgin IslanderUgandanUkrainianUruguayanUteVenezuelanVietnameseWelshWest IndianYakamaYaquiYugoslavianYumanYup'ikZimbabwean
Immigration
NonimmigrantsImmigrantsAfghanistanAfricaAlbaniaArgentinaArmeniaAsiaAustraliaAustriaBahamasBangladeshBarbadosBelarusBelgiumBelizeBoliviaBosnia and HerzegovinaBrazilBulgariaBurma/MyanmarCabo VerdeCambodiaCameroonCanadaCaribbeanCentral AmericaChileChinaColombiaCongoCosta RicaCroatiaCubaCzechoslovakiaDenmarkDominicaDominican RepublicEastern AfricaEastern AsiaEastern EuropeEcuadorEgyptEl SalvadorEnglandEritreaEthiopiaEuropeFijiFranceGermanyGhanaGreeceGrenadaGuatemalaGuyanaHaitiHondurasHong KongHungaryIndiaIndonesiaIranIraqIrelandIsraelItalyJamaicaJapanJordanKazakhstanKoreaKuwaitLaosLatin AmericaLatviaLebanonLiberiaLithuaniaMalaysiaMexicoMicronesiaMiddle AfricaMoldovaMoroccoNepalNetherlandsNicaraguaNigeriaNorth AmericaNorth MacedoniaNorthern AfricaNorthern EuropeNorwayOceaniaPakistanPanamaPeruPhilippinesPolandPortugalRomaniaRussiaSaudi ArabiaScotlandSenegalSerbiaSierra LeoneSingaporeSomaliaSouth AfricaSouth AmericaSouth Central AsiaSouth Eastern AsiaSouthern EuropeSpainSri LankaSt. Vincent and the GrenadinesSudanSwedenSwitzerlandSyriaTaiwanThailandTrinidad and TobagoTurkeyUgandaUkraineUruguayUzbekistanVenezuelaVietnamWest IndiesWestern AfricaWestern AsiaWestern EuropeYemenZaireZimbabweAzores
3rd Grade
Income
Poverty
Unemployment
Labor Participation
Family Structure
Vehicle Availability
Education Level
Disability

3rd Grade Comparison

Immigrants from Kenya

Immigrants from Barbados

Fair
Tragic
97.7%
3RD GRADE
28.2/ 100
METRIC RATING
193rd/ 347
METRIC RANK
97.1%
3RD GRADE
0.0/ 100
METRIC RATING
286th/ 347
METRIC RANK

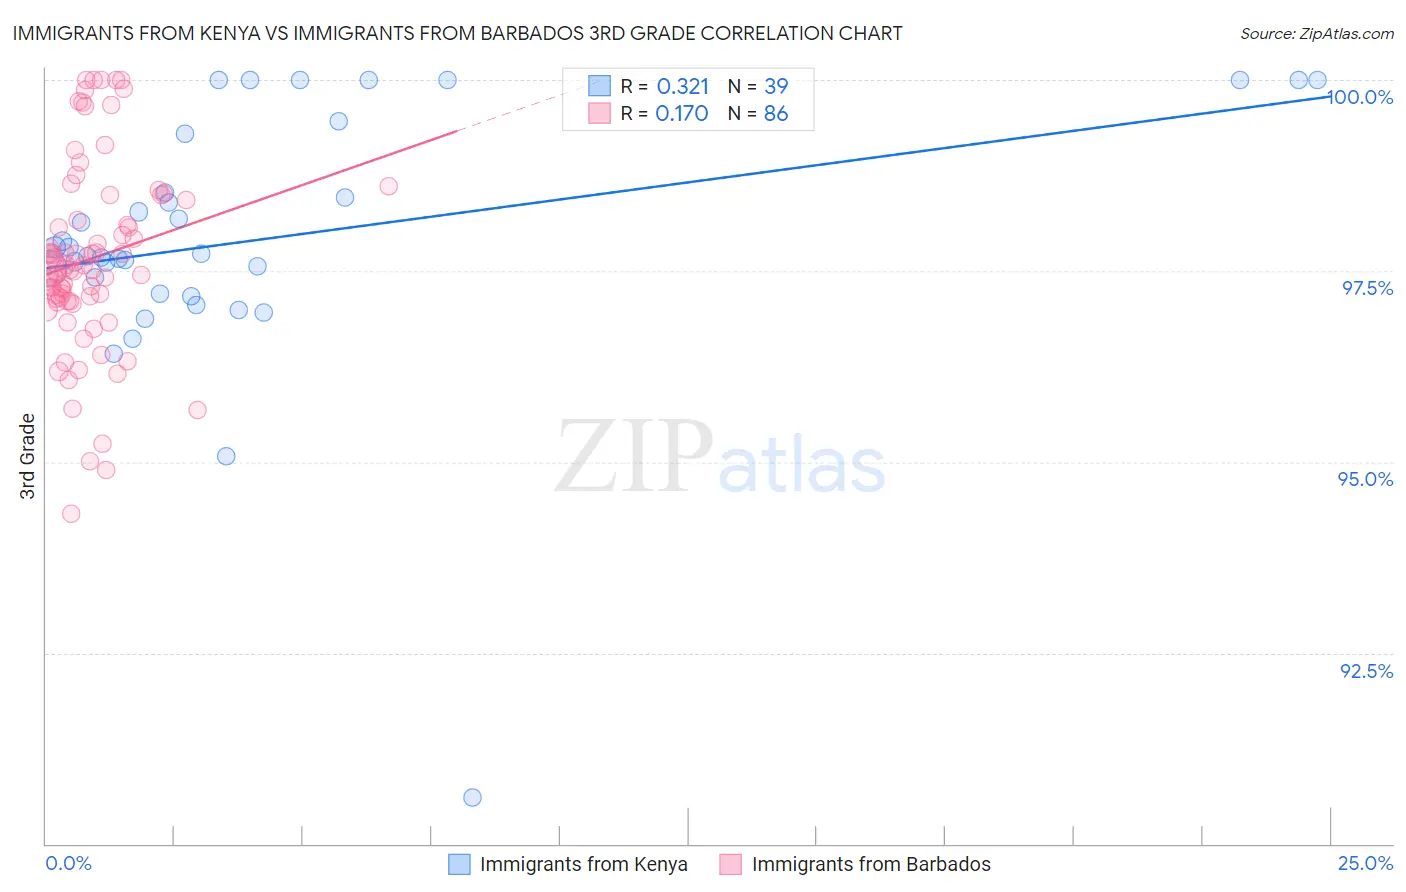
Immigrants from Kenya vs Immigrants from Barbados 3rd Grade Correlation Chart

The statistical analysis conducted on geographies consisting of 218,076,690 people shows a mild positive correlation between the proportion of Immigrants from Kenya and percentage of population with at least 3rd grade education in the United States with a correlation coefficient (R) of 0.321 and weighted average of 97.7%. Similarly, the statistical analysis conducted on geographies consisting of 112,787,503 people shows a poor positive correlation between the proportion of Immigrants from Barbados and percentage of population with at least 3rd grade education in the United States with a correlation coefficient (R) of 0.170 and weighted average of 97.1%, a difference of 0.61%.
Immigrants from Kenya vs Immigrants from Barbados 3rd Grade

3rd Grade Correlation Summary

MeasurementImmigrants from KenyaImmigrants from Barbados
Minimum90.6%94.3%
Maximum100.0%100.0%
Range9.4%5.7%
Mean97.9%97.7%
Median97.7%97.5%
Interquartile 25% (IQ1)97.2%97.1%
Interquartile 75% (IQ3)99.3%98.4%
Interquartile Range (IQR)2.1%1.3%
Standard Deviation (Sample)1.7%1.2%
Standard Deviation (Population)1.7%1.2%

Similar Demographics by 3rd Grade

Demographics Similar to Immigrants from Kenya by 3rd Grade

In terms of 3rd grade, the demographic groups most similar to Immigrants from Kenya are Mongolian (97.7%, a difference of 0.0%), Immigrants from Uganda (97.7%, a difference of 0.0%), Panamanian (97.7%, a difference of 0.010%), Black/African American (97.7%, a difference of 0.010%), and Immigrants from Egypt (97.7%, a difference of 0.010%).
DemographicsRating | Rank3rd Grade
Portuguese
36.2
/100
|
#186
Fair
97.7%
Natives/Alaskans
35.2
/100
|
#187
Fair
97.7%
Immigrants | Taiwan
34.2
/100
|
#188
Fair
97.7%
Pakistanis
34.2
/100
|
#189
Fair
97.7%
Panamanians
31.5
/100
|
#190
Fair
97.7%
Blacks/African Americans
29.6
/100
|
#191
Fair
97.7%
Mongolians
29.1
/100
|
#192
Fair
97.7%
Immigrants | Kenya
28.2
/100
|
#193
Fair
97.7%
Immigrants | Uganda
27.4
/100
|
#194
Fair
97.7%
Immigrants | Egypt
26.8
/100
|
#195
Fair
97.7%
Paraguayans
26.2
/100
|
#196
Fair
97.7%
Hawaiians
25.7
/100
|
#197
Fair
97.7%
Guamanians/Chamorros
23.6
/100
|
#198
Fair
97.7%
Immigrants | Ukraine
22.7
/100
|
#199
Fair
97.7%
Immigrants | Albania
22.6
/100
|
#200
Fair
97.7%

Demographics Similar to Immigrants from Barbados by 3rd Grade

In terms of 3rd grade, the demographic groups most similar to Immigrants from Barbados are Immigrants from Hong Kong (97.1%, a difference of 0.010%), Immigrants from St. Vincent and the Grenadines (97.1%, a difference of 0.010%), Immigrants from West Indies (97.1%, a difference of 0.010%), Immigrants from Thailand (97.1%, a difference of 0.020%), and Immigrants from Trinidad and Tobago (97.1%, a difference of 0.030%).
DemographicsRating | Rank3rd Grade
Immigrants | Philippines
0.1
/100
|
#279
Tragic
97.2%
Immigrants | Ghana
0.1
/100
|
#280
Tragic
97.2%
Barbadians
0.1
/100
|
#281
Tragic
97.2%
Afghans
0.1
/100
|
#282
Tragic
97.1%
Houma
0.1
/100
|
#283
Tragic
97.1%
Immigrants | Trinidad and Tobago
0.0
/100
|
#284
Tragic
97.1%
Immigrants | Hong Kong
0.0
/100
|
#285
Tragic
97.1%
Immigrants | Barbados
0.0
/100
|
#286
Tragic
97.1%
Immigrants | St. Vincent and the Grenadines
0.0
/100
|
#287
Tragic
97.1%
Immigrants | West Indies
0.0
/100
|
#288
Tragic
97.1%
Immigrants | Thailand
0.0
/100
|
#289
Tragic
97.1%
Immigrants | Portugal
0.0
/100
|
#290
Tragic
97.0%
Immigrants | Afghanistan
0.0
/100
|
#291
Tragic
97.0%
British West Indians
0.0
/100
|
#292
Tragic
97.0%
Immigrants | Grenada
0.0
/100
|
#293
Tragic
97.0%