Immigrants from Kenya vs Bermudan Kindergarten

COMPARE

Immigrants from Kenya
Race
Ancestry
AfghanAfricanAlaska NativeAlaskan AthabascanAlbanianAleutAlsatianAmericanApacheArabArapahoArgentineanArmenianAssyrian/Chaldean/SyriacAustralianAustrianBahamianBangladeshiBarbadianBasqueBelgianBelizeanBhutaneseBlackfeetBolivianBrazilianBritishBritish West IndianBulgarianBurmeseCajunCambodianCanadianCape VerdeanCarpatho RusynCelticCentral AmericanCentral American IndianCherokeeCheyenneChickasawChileanChineseChippewaChoctawColombianColvilleComancheCosta RicanCreeCreekCroatianCrowCubanCypriotCzechCzechoslovakianDanishDelawareDominicanDutchDutch West IndianEastern EuropeanEcuadorianEgyptianEnglishEstonianEthiopianEuropeanFijianFilipinoFinnishFrenchFrench American IndianFrench CanadianGermanGerman RussianGhanaianGreekGuamanian/ChamorroGuatemalanGuyaneseHaitianHmongHonduranHopiHoumaHungarianIcelanderIndian (Asian)IndonesianInupiatIranianIraqiIrishIroquoisIsraeliItalianJamaicanJapaneseJordanianKenyanKiowaKoreanLaotianLatvianLebaneseLiberianLithuanianLumbeeLuxembourgerMacedonianMalaysianMalteseMarshalleseMenomineeMexicanMexican American IndianMongolianMoroccanNative HawaiianNavajoNepaleseNew ZealanderNicaraguanNigerianNorthern EuropeanNorwegianOkinawanOsageOttawaPaiutePakistaniPalestinianPanamanianParaguayanPennsylvania GermanPeruvianPimaPolishPortuguesePotawatomiPuebloPuerto RicanPuget Sound SalishRomanianRussianSalvadoranSamoanScandinavianScotch-IrishScottishSeminoleSenegaleseSerbianShoshoneSierra LeoneanSiouxSlavicSlovakSloveneSomaliSouth AfricanSouth AmericanSouth American IndianSoviet UnionSpaniardSpanishSpanish AmericanSpanish American IndianSri LankanSubsaharan AfricanSudaneseSwedishSwissSyrianTaiwaneseThaiTlingit-HaidaTohono O'OdhamTonganTrinidadian and TobagonianTsimshianTurkishU.S. Virgin IslanderUgandanUkrainianUruguayanUteVenezuelanVietnameseWelshWest IndianYakamaYaquiYugoslavianYumanYup'ikZimbabwean
Immigration
NonimmigrantsImmigrantsAfghanistanAfricaAlbaniaArgentinaArmeniaAsiaAustraliaAustriaBahamasBangladeshBarbadosBelarusBelgiumBelizeBoliviaBosnia and HerzegovinaBrazilBulgariaBurma/MyanmarCabo VerdeCambodiaCameroonCanadaCaribbeanCentral AmericaChileChinaColombiaCongoCosta RicaCroatiaCubaCzechoslovakiaDenmarkDominicaDominican RepublicEastern AfricaEastern AsiaEastern EuropeEcuadorEgyptEl SalvadorEnglandEritreaEthiopiaEuropeFijiFranceGermanyGhanaGreeceGrenadaGuatemalaGuyanaHaitiHondurasHong KongHungaryIndiaIndonesiaIranIraqIrelandIsraelItalyJamaicaJapanJordanKazakhstanKenyaKoreaKuwaitLaosLatin AmericaLatviaLebanonLiberiaLithuaniaMalaysiaMexicoMicronesiaMiddle AfricaMoldovaMoroccoNepalNetherlandsNicaraguaNigeriaNorth AmericaNorth MacedoniaNorthern AfricaNorthern EuropeNorwayOceaniaPakistanPanamaPeruPhilippinesPolandPortugalRomaniaRussiaSaudi ArabiaScotlandSenegalSerbiaSierra LeoneSingaporeSomaliaSouth AfricaSouth AmericaSouth Central AsiaSouth Eastern AsiaSouthern EuropeSpainSri LankaSt. Vincent and the GrenadinesSudanSwedenSwitzerlandSyriaTaiwanThailandTrinidad and TobagoTurkeyUgandaUkraineUruguayUzbekistanVenezuelaVietnamWest IndiesWestern AfricaWestern AsiaWestern EuropeYemenZaireZimbabweAzores
Bermudan
Race
Ancestry
AfghanAfricanAlaska NativeAlaskan AthabascanAlbanianAleutAlsatianAmericanApacheArabArapahoArgentineanArmenianAssyrian/Chaldean/SyriacAustralianAustrianBahamianBangladeshiBarbadianBasqueBelgianBelizeanBermudanBhutaneseBlackfeetBolivianBrazilianBritishBritish West IndianBulgarianBurmeseCajunCambodianCanadianCape VerdeanCarpatho RusynCelticCentral AmericanCentral American IndianCherokeeCheyenneChickasawChileanChineseChippewaChoctawColombianColvilleComancheCosta RicanCreeCreekCroatianCrowCubanCypriotCzechCzechoslovakianDanishDelawareDominicanDutchDutch West IndianEastern EuropeanEcuadorianEgyptianEnglishEstonianEthiopianEuropeanFijianFilipinoFinnishFrenchFrench American IndianFrench CanadianGermanGerman RussianGhanaianGreekGuamanian/ChamorroGuatemalanGuyaneseHaitianHmongHonduranHopiHoumaHungarianIcelanderIndian (Asian)IndonesianInupiatIranianIraqiIrishIroquoisIsraeliItalianJamaicanJapaneseJordanianKenyanKiowaKoreanLaotianLatvianLebaneseLiberianLithuanianLumbeeLuxembourgerMacedonianMalaysianMalteseMarshalleseMenomineeMexicanMexican American IndianMongolianMoroccanNative HawaiianNavajoNepaleseNew ZealanderNicaraguanNigerianNorthern EuropeanNorwegianOkinawanOsageOttawaPaiutePakistaniPalestinianPanamanianParaguayanPennsylvania GermanPeruvianPimaPolishPortuguesePotawatomiPuebloPuerto RicanPuget Sound SalishRomanianRussianSalvadoranSamoanScandinavianScotch-IrishScottishSeminoleSenegaleseSerbianShoshoneSierra LeoneanSiouxSlavicSlovakSloveneSomaliSouth AfricanSouth AmericanSouth American IndianSoviet UnionSpaniardSpanishSpanish AmericanSpanish American IndianSri LankanSubsaharan AfricanSudaneseSwedishSwissSyrianTaiwaneseThaiTlingit-HaidaTohono O'OdhamTonganTrinidadian and TobagonianTsimshianTurkishU.S. Virgin IslanderUgandanUkrainianUruguayanUteVenezuelanVietnameseWelshWest IndianYakamaYaquiYugoslavianYumanYup'ikZimbabwean
Immigration
NonimmigrantsImmigrantsAfghanistanAfricaAlbaniaArgentinaArmeniaAsiaAustraliaAustriaBahamasBangladeshBarbadosBelarusBelgiumBelizeBoliviaBosnia and HerzegovinaBrazilBulgariaBurma/MyanmarCabo VerdeCambodiaCameroonCanadaCaribbeanCentral AmericaChileChinaColombiaCongoCosta RicaCroatiaCubaCzechoslovakiaDenmarkDominicaDominican RepublicEastern AfricaEastern AsiaEastern EuropeEcuadorEgyptEl SalvadorEnglandEritreaEthiopiaEuropeFijiFranceGermanyGhanaGreeceGrenadaGuatemalaGuyanaHaitiHondurasHong KongHungaryIndiaIndonesiaIranIraqIrelandIsraelItalyJamaicaJapanJordanKazakhstanKoreaKuwaitLaosLatin AmericaLatviaLebanonLiberiaLithuaniaMalaysiaMexicoMicronesiaMiddle AfricaMoldovaMoroccoNepalNetherlandsNicaraguaNigeriaNorth AmericaNorth MacedoniaNorthern AfricaNorthern EuropeNorwayOceaniaPakistanPanamaPeruPhilippinesPolandPortugalRomaniaRussiaSaudi ArabiaScotlandSenegalSerbiaSierra LeoneSingaporeSomaliaSouth AfricaSouth AmericaSouth Central AsiaSouth Eastern AsiaSouthern EuropeSpainSri LankaSt. Vincent and the GrenadinesSudanSwedenSwitzerlandSyriaTaiwanThailandTrinidad and TobagoTurkeyUgandaUkraineUruguayUzbekistanVenezuelaVietnamWest IndiesWestern AfricaWestern AsiaWestern EuropeYemenZaireZimbabweAzores
Kindergarten
Income
Poverty
Unemployment
Labor Participation
Family Structure
Vehicle Availability
Education Level
Disability

Kindergarten Comparison

Immigrants from Kenya

Bermudans

Fair
Average
97.9%
KINDERGARTEN
25.5/ 100
METRIC RATING
197th/ 347
METRIC RANK
98.0%
KINDERGARTEN
54.0/ 100
METRIC RATING
170th/ 347
METRIC RANK

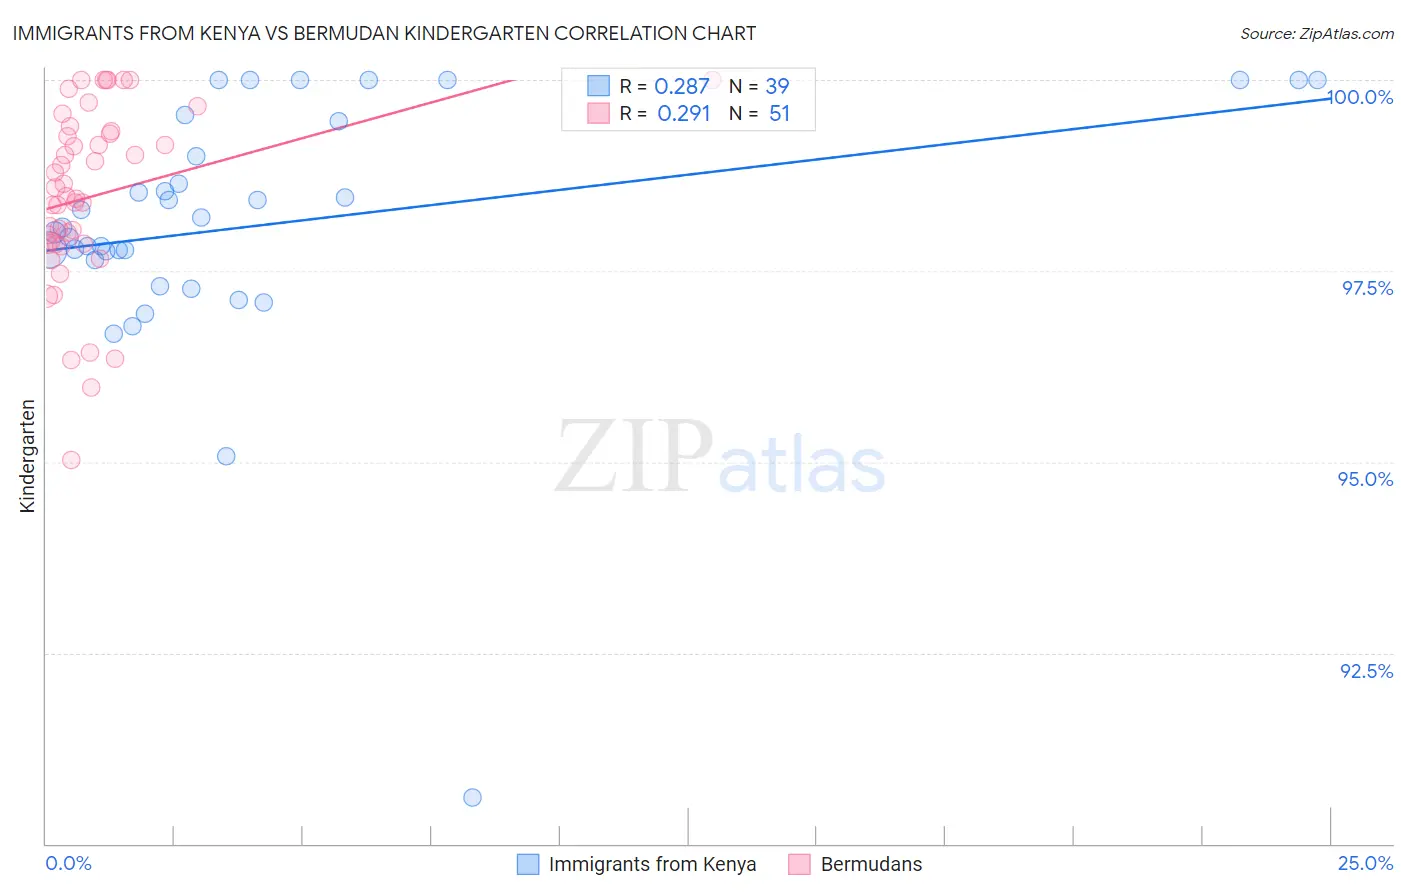
Immigrants from Kenya vs Bermudan Kindergarten Correlation Chart

The statistical analysis conducted on geographies consisting of 218,076,690 people shows a weak positive correlation between the proportion of Immigrants from Kenya and percentage of population with at least kindergarten education in the United States with a correlation coefficient (R) of 0.287 and weighted average of 97.9%. Similarly, the statistical analysis conducted on geographies consisting of 55,721,975 people shows a weak positive correlation between the proportion of Bermudans and percentage of population with at least kindergarten education in the United States with a correlation coefficient (R) of 0.291 and weighted average of 98.0%, a difference of 0.10%.
Immigrants from Kenya vs Bermudan Kindergarten

Kindergarten Correlation Summary

MeasurementImmigrants from KenyaBermudan
Minimum90.6%95.0%
Maximum100.0%100.0%
Range9.4%5.0%
Mean98.1%98.5%
Median98.1%98.5%
Interquartile 25% (IQ1)97.6%97.9%
Interquartile 75% (IQ3)99.5%99.3%
Interquartile Range (IQR)1.8%1.5%
Standard Deviation (Sample)1.7%1.2%
Standard Deviation (Population)1.7%1.2%

Similar Demographics by Kindergarten

Demographics Similar to Immigrants from Kenya by Kindergarten

In terms of kindergarten, the demographic groups most similar to Immigrants from Kenya are Guamanian/Chamorro (97.9%, a difference of 0.0%), Tohono O'odham (97.9%, a difference of 0.0%), Hawaiian (97.9%, a difference of 0.010%), Mongolian (97.9%, a difference of 0.010%), and Immigrants from Egypt (97.9%, a difference of 0.010%).
DemographicsRating | RankKindergarten
Panamanians
33.3
/100
|
#190
Fair
97.9%
Immigrants | Taiwan
30.7
/100
|
#191
Fair
97.9%
Blacks/African Americans
29.9
/100
|
#192
Fair
97.9%
Paraguayans
29.6
/100
|
#193
Fair
97.9%
Hawaiians
29.3
/100
|
#194
Fair
97.9%
Mongolians
28.9
/100
|
#195
Fair
97.9%
Guamanians/Chamorros
26.2
/100
|
#196
Fair
97.9%
Immigrants | Kenya
25.5
/100
|
#197
Fair
97.9%
Tohono O'odham
24.6
/100
|
#198
Fair
97.9%
Immigrants | Egypt
22.3
/100
|
#199
Fair
97.9%
Yuman
21.6
/100
|
#200
Fair
97.9%
Immigrants | Lebanon
20.9
/100
|
#201
Fair
97.9%
Immigrants | Ukraine
19.1
/100
|
#202
Poor
97.8%
Immigrants | Uganda
18.8
/100
|
#203
Poor
97.8%
Immigrants | Chile
18.1
/100
|
#204
Poor
97.8%

Demographics Similar to Bermudans by Kindergarten

In terms of kindergarten, the demographic groups most similar to Bermudans are Immigrants from Spain (98.0%, a difference of 0.0%), Navajo (98.0%, a difference of 0.0%), Immigrants from Korea (98.0%, a difference of 0.0%), Immigrants from Jordan (98.0%, a difference of 0.0%), and Spanish American (98.0%, a difference of 0.010%).
DemographicsRating | RankKindergarten
Spanish Americans
57.8
/100
|
#163
Average
98.0%
Immigrants | Micronesia
57.7
/100
|
#164
Average
98.0%
Ugandans
56.9
/100
|
#165
Average
98.0%
Chileans
56.3
/100
|
#166
Average
98.0%
Immigrants | Spain
54.6
/100
|
#167
Average
98.0%
Navajo
54.4
/100
|
#168
Average
98.0%
Immigrants | Korea
54.1
/100
|
#169
Average
98.0%
Bermudans
54.0
/100
|
#170
Average
98.0%
Immigrants | Jordan
54.0
/100
|
#171
Average
98.0%
Natives/Alaskans
51.0
/100
|
#172
Average
98.0%
Kenyans
51.0
/100
|
#173
Average
98.0%
Immigrants | Brazil
50.0
/100
|
#174
Average
98.0%
Immigrants | Sri Lanka
49.6
/100
|
#175
Average
97.9%
Albanians
48.5
/100
|
#176
Average
97.9%
Immigrants | Venezuela
47.9
/100
|
#177
Average
97.9%