Immigrants from Jordan vs Immigrants from Africa 5th Grade

COMPARE

Immigrants from Jordan
Race
Ancestry
AfghanAfricanAlaska NativeAlaskan AthabascanAlbanianAleutAlsatianAmericanApacheArabArapahoArgentineanArmenianAssyrian/Chaldean/SyriacAustralianAustrianBahamianBangladeshiBarbadianBasqueBelgianBelizeanBermudanBhutaneseBlackfeetBolivianBrazilianBritishBritish West IndianBulgarianBurmeseCajunCambodianCanadianCape VerdeanCarpatho RusynCelticCentral AmericanCentral American IndianCherokeeCheyenneChickasawChileanChineseChippewaChoctawColombianColvilleComancheCosta RicanCreeCreekCroatianCrowCubanCypriotCzechCzechoslovakianDanishDelawareDominicanDutchDutch West IndianEastern EuropeanEcuadorianEgyptianEnglishEstonianEthiopianEuropeanFijianFilipinoFinnishFrenchFrench American IndianFrench CanadianGermanGerman RussianGhanaianGreekGuamanian/ChamorroGuatemalanGuyaneseHaitianHmongHonduranHopiHoumaHungarianIcelanderIndian (Asian)IndonesianInupiatIranianIraqiIrishIroquoisIsraeliItalianJamaicanJapaneseJordanianKenyanKiowaKoreanLaotianLatvianLebaneseLiberianLithuanianLumbeeLuxembourgerMacedonianMalaysianMalteseMarshalleseMenomineeMexicanMexican American IndianMongolianMoroccanNative HawaiianNavajoNepaleseNew ZealanderNicaraguanNigerianNorthern EuropeanNorwegianOkinawanOsageOttawaPaiutePakistaniPalestinianPanamanianParaguayanPennsylvania GermanPeruvianPimaPolishPortuguesePotawatomiPuebloPuerto RicanPuget Sound SalishRomanianRussianSalvadoranSamoanScandinavianScotch-IrishScottishSeminoleSenegaleseSerbianShoshoneSierra LeoneanSiouxSlavicSlovakSloveneSomaliSouth AfricanSouth AmericanSouth American IndianSoviet UnionSpaniardSpanishSpanish AmericanSpanish American IndianSri LankanSubsaharan AfricanSudaneseSwedishSwissSyrianTaiwaneseThaiTlingit-HaidaTohono O'OdhamTonganTrinidadian and TobagonianTsimshianTurkishU.S. Virgin IslanderUgandanUkrainianUruguayanUteVenezuelanVietnameseWelshWest IndianYakamaYaquiYugoslavianYumanYup'ikZimbabwean
Immigration
NonimmigrantsImmigrantsAfghanistanAlbaniaArgentinaArmeniaAsiaAustraliaAustriaBahamasBangladeshBarbadosBelarusBelgiumBelizeBoliviaBosnia and HerzegovinaBrazilBulgariaBurma/MyanmarCabo VerdeCambodiaCameroonCanadaCaribbeanCentral AmericaChileChinaColombiaCongoCosta RicaCroatiaCubaCzechoslovakiaDenmarkDominicaDominican RepublicEastern AfricaEastern AsiaEastern EuropeEcuadorEgyptEl SalvadorEnglandEritreaEthiopiaEuropeFijiFranceGermanyGhanaGreeceGrenadaGuatemalaGuyanaHaitiHondurasHong KongHungaryIndiaIndonesiaIranIraqIrelandIsraelItalyJamaicaJapanJordanKazakhstanKenyaKoreaKuwaitLaosLatin AmericaLatviaLebanonLiberiaLithuaniaMalaysiaMexicoMicronesiaMiddle AfricaMoldovaMoroccoNepalNetherlandsNicaraguaNigeriaNorth AmericaNorth MacedoniaNorthern AfricaNorthern EuropeNorwayOceaniaPakistanPanamaPeruPhilippinesPolandPortugalRomaniaRussiaSaudi ArabiaScotlandSenegalSerbiaSierra LeoneSingaporeSomaliaSouth AfricaSouth AmericaSouth Central AsiaSouth Eastern AsiaSouthern EuropeSpainSri LankaSt. Vincent and the GrenadinesSudanSwedenSwitzerlandSyriaTaiwanThailandTrinidad and TobagoTurkeyUgandaUkraineUruguayUzbekistanVenezuelaVietnamWest IndiesWestern AfricaWestern AsiaWestern EuropeYemenZaireZimbabweAzores
Immigrants from Africa
Race
Ancestry
AfghanAfricanAlaska NativeAlaskan AthabascanAlbanianAleutAlsatianAmericanApacheArabArapahoArgentineanArmenianAssyrian/Chaldean/SyriacAustralianAustrianBahamianBangladeshiBarbadianBasqueBelgianBelizeanBermudanBhutaneseBlackfeetBolivianBrazilianBritishBritish West IndianBulgarianBurmeseCajunCambodianCanadianCape VerdeanCarpatho RusynCelticCentral AmericanCentral American IndianCherokeeCheyenneChickasawChileanChineseChippewaChoctawColombianColvilleComancheCosta RicanCreeCreekCroatianCrowCubanCypriotCzechCzechoslovakianDanishDelawareDominicanDutchDutch West IndianEastern EuropeanEcuadorianEgyptianEnglishEstonianEthiopianEuropeanFijianFilipinoFinnishFrenchFrench American IndianFrench CanadianGermanGerman RussianGhanaianGreekGuamanian/ChamorroGuatemalanGuyaneseHaitianHmongHonduranHopiHoumaHungarianIcelanderIndian (Asian)IndonesianInupiatIranianIraqiIrishIroquoisIsraeliItalianJamaicanJapaneseJordanianKenyanKiowaKoreanLaotianLatvianLebaneseLiberianLithuanianLumbeeLuxembourgerMacedonianMalaysianMalteseMarshalleseMenomineeMexicanMexican American IndianMongolianMoroccanNative HawaiianNavajoNepaleseNew ZealanderNicaraguanNigerianNorthern EuropeanNorwegianOkinawanOsageOttawaPaiutePakistaniPalestinianPanamanianParaguayanPennsylvania GermanPeruvianPimaPolishPortuguesePotawatomiPuebloPuerto RicanPuget Sound SalishRomanianRussianSalvadoranSamoanScandinavianScotch-IrishScottishSeminoleSenegaleseSerbianShoshoneSierra LeoneanSiouxSlavicSlovakSloveneSomaliSouth AfricanSouth AmericanSouth American IndianSoviet UnionSpaniardSpanishSpanish AmericanSpanish American IndianSri LankanSubsaharan AfricanSudaneseSwedishSwissSyrianTaiwaneseThaiTlingit-HaidaTohono O'OdhamTonganTrinidadian and TobagonianTsimshianTurkishU.S. Virgin IslanderUgandanUkrainianUruguayanUteVenezuelanVietnameseWelshWest IndianYakamaYaquiYugoslavianYumanYup'ikZimbabwean
Immigration
NonimmigrantsImmigrantsAfghanistanAfricaAlbaniaArgentinaArmeniaAsiaAustraliaAustriaBahamasBangladeshBarbadosBelarusBelgiumBelizeBoliviaBosnia and HerzegovinaBrazilBulgariaBurma/MyanmarCabo VerdeCambodiaCameroonCanadaCaribbeanCentral AmericaChileChinaColombiaCongoCosta RicaCroatiaCubaCzechoslovakiaDenmarkDominicaDominican RepublicEastern AfricaEastern AsiaEastern EuropeEcuadorEgyptEl SalvadorEnglandEritreaEthiopiaEuropeFijiFranceGermanyGhanaGreeceGrenadaGuatemalaGuyanaHaitiHondurasHong KongHungaryIndiaIndonesiaIranIraqIrelandIsraelItalyJamaicaJapanKazakhstanKenyaKoreaKuwaitLaosLatin AmericaLatviaLebanonLiberiaLithuaniaMalaysiaMexicoMicronesiaMiddle AfricaMoldovaMoroccoNepalNetherlandsNicaraguaNigeriaNorth AmericaNorth MacedoniaNorthern AfricaNorthern EuropeNorwayOceaniaPakistanPanamaPeruPhilippinesPolandPortugalRomaniaRussiaSaudi ArabiaScotlandSenegalSerbiaSierra LeoneSingaporeSomaliaSouth AfricaSouth AmericaSouth Central AsiaSouth Eastern AsiaSouthern EuropeSpainSri LankaSt. Vincent and the GrenadinesSudanSwedenSwitzerlandSyriaTaiwanThailandTrinidad and TobagoTurkeyUgandaUkraineUruguayUzbekistanVenezuelaVietnamWest IndiesWestern AfricaWestern AsiaWestern EuropeYemenZaireZimbabweAzores
5th Grade
Income
Poverty
Unemployment
Labor Participation
Family Structure
Vehicle Availability
Education Level
Disability

5th Grade Comparison

Immigrants from Jordan

Immigrants from Africa

Good
Tragic
97.4%
5TH GRADE
70.4/ 100
METRIC RATING
157th/ 347
METRIC RANK
96.9%
5TH GRADE
1.1/ 100
METRIC RATING
247th/ 347
METRIC RANK

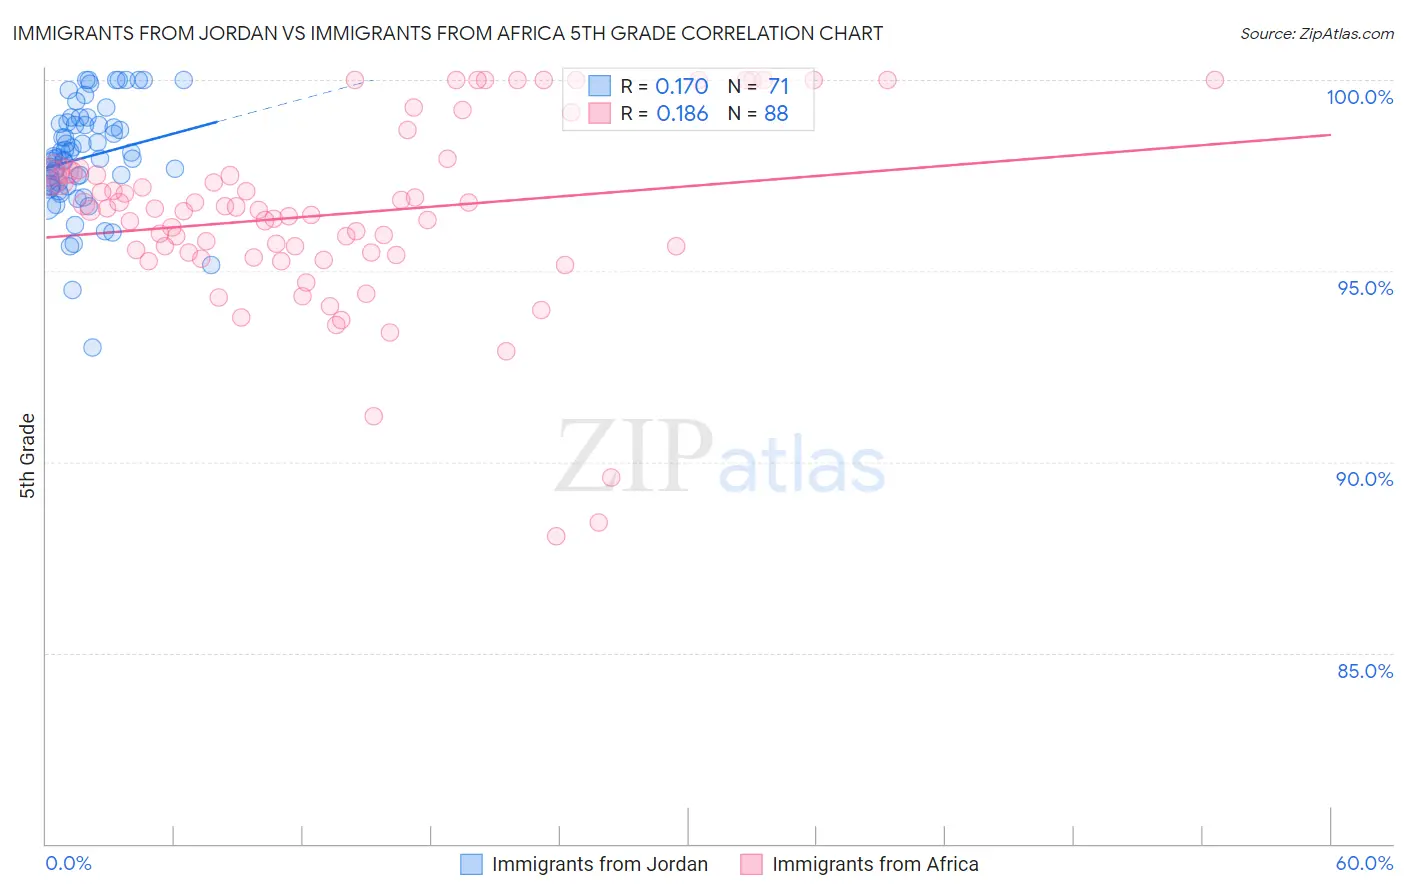
Immigrants from Jordan vs Immigrants from Africa 5th Grade Correlation Chart

The statistical analysis conducted on geographies consisting of 181,269,915 people shows a poor positive correlation between the proportion of Immigrants from Jordan and percentage of population with at least 5th grade education in the United States with a correlation coefficient (R) of 0.170 and weighted average of 97.4%. Similarly, the statistical analysis conducted on geographies consisting of 469,408,495 people shows a poor positive correlation between the proportion of Immigrants from Africa and percentage of population with at least 5th grade education in the United States with a correlation coefficient (R) of 0.186 and weighted average of 96.9%, a difference of 0.56%.
Immigrants from Jordan vs Immigrants from Africa 5th Grade

5th Grade Correlation Summary

MeasurementImmigrants from JordanImmigrants from Africa
Minimum93.0%88.1%
Maximum100.0%100.0%
Range7.0%11.9%
Mean98.0%96.5%
Median98.0%96.6%
Interquartile 25% (IQ1)97.2%95.4%
Interquartile 75% (IQ3)98.8%97.6%
Interquartile Range (IQR)1.6%2.1%
Standard Deviation (Sample)1.4%2.4%
Standard Deviation (Population)1.4%2.4%

Similar Demographics by 5th Grade

Demographics Similar to Immigrants from Jordan by 5th Grade

In terms of 5th grade, the demographic groups most similar to Immigrants from Jordan are Immigrants from Russia (97.4%, a difference of 0.0%), Immigrants from Bosnia and Herzegovina (97.4%, a difference of 0.0%), French American Indian (97.4%, a difference of 0.0%), Albanian (97.4%, a difference of 0.010%), and Immigrants from Eastern Europe (97.4%, a difference of 0.020%).
DemographicsRating | Rank5th Grade
Immigrants | South Central Asia
78.6
/100
|
#150
Good
97.5%
Immigrants | Eastern Europe
75.0
/100
|
#151
Good
97.4%
Ute
74.9
/100
|
#152
Good
97.4%
Alsatians
74.3
/100
|
#153
Good
97.4%
Immigrants | Russia
71.2
/100
|
#154
Good
97.4%
Immigrants | Bosnia and Herzegovina
71.0
/100
|
#155
Good
97.4%
French American Indians
70.5
/100
|
#156
Good
97.4%
Immigrants | Jordan
70.4
/100
|
#157
Good
97.4%
Albanians
68.3
/100
|
#158
Good
97.4%
Immigrants | Italy
65.2
/100
|
#159
Good
97.4%
Marshallese
61.2
/100
|
#160
Good
97.4%
Kenyans
59.7
/100
|
#161
Average
97.4%
Immigrants | Iran
59.5
/100
|
#162
Average
97.4%
Ugandans
58.9
/100
|
#163
Average
97.4%
Bermudans
58.8
/100
|
#164
Average
97.4%

Demographics Similar to Immigrants from Africa by 5th Grade

In terms of 5th grade, the demographic groups most similar to Immigrants from Africa are U.S. Virgin Islander (96.9%, a difference of 0.0%), Ethiopian (96.9%, a difference of 0.010%), Immigrants from Uruguay (96.9%, a difference of 0.010%), Immigrants from Liberia (96.9%, a difference of 0.010%), and Bolivian (96.9%, a difference of 0.010%).
DemographicsRating | Rank5th Grade
Indians (Asian)
1.9
/100
|
#240
Tragic
96.9%
Immigrants | Asia
1.7
/100
|
#241
Tragic
96.9%
Immigrants | Costa Rica
1.6
/100
|
#242
Tragic
96.9%
Immigrants | Eastern Africa
1.6
/100
|
#243
Tragic
96.9%
Koreans
1.6
/100
|
#244
Tragic
96.9%
Colombians
1.3
/100
|
#245
Tragic
96.9%
Ethiopians
1.2
/100
|
#246
Tragic
96.9%
Immigrants | Africa
1.1
/100
|
#247
Tragic
96.9%
U.S. Virgin Islanders
1.1
/100
|
#248
Tragic
96.9%
Immigrants | Uruguay
1.0
/100
|
#249
Tragic
96.9%
Immigrants | Liberia
1.0
/100
|
#250
Tragic
96.9%
Bolivians
0.9
/100
|
#251
Tragic
96.9%
Jamaicans
0.9
/100
|
#252
Tragic
96.9%
Immigrants | Middle Africa
0.8
/100
|
#253
Tragic
96.8%
Immigrants | Senegal
0.8
/100
|
#254
Tragic
96.8%