Immigrants from Jordan vs Alaska Native 2nd Grade
COMPARE
Immigrants from Jordan
Alaska Native
2nd Grade
2nd Grade Comparison
Immigrants from Jordan
Alaska Natives
97.9%
2ND GRADE
56.3/ 100
METRIC RATING
166th/ 347
METRIC RANK
98.7%
2ND GRADE
100.0/ 100
METRIC RATING
6th/ 347
METRIC RANK
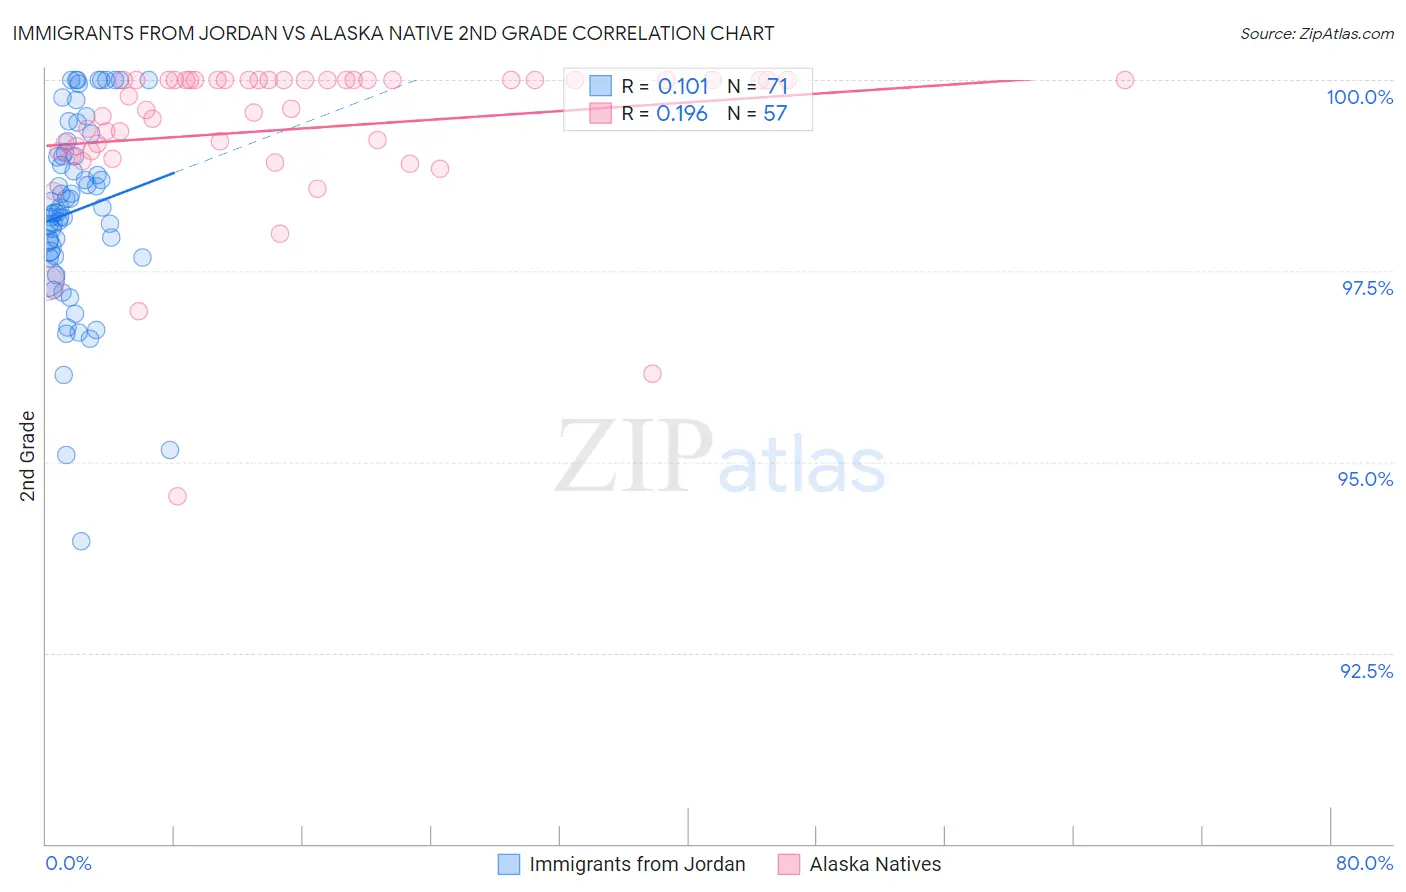
Immigrants from Jordan vs Alaska Native 2nd Grade Correlation Chart
The statistical analysis conducted on geographies consisting of 181,269,915 people shows a poor positive correlation between the proportion of Immigrants from Jordan and percentage of population with at least 2nd grade education in the United States with a correlation coefficient (R) of 0.101 and weighted average of 97.9%. Similarly, the statistical analysis conducted on geographies consisting of 76,775,774 people shows a poor positive correlation between the proportion of Alaska Natives and percentage of population with at least 2nd grade education in the United States with a correlation coefficient (R) of 0.196 and weighted average of 98.7%, a difference of 0.81%.
2nd Grade Correlation Summary
| Measurement | Immigrants from Jordan | Alaska Native |
| Minimum | 94.0% | 94.6% |
| Maximum | 100.0% | 100.0% |
| Range | 6.0% | 5.4% |
| Mean | 98.3% | 99.4% |
| Median | 98.3% | 99.8% |
| Interquartile 25% (IQ1) | 97.7% | 99.1% |
| Interquartile 75% (IQ3) | 99.1% | 100.0% |
| Interquartile Range (IQR) | 1.4% | 0.93% |
| Standard Deviation (Sample) | 1.2% | 1.0% |
| Standard Deviation (Population) | 1.2% | 1.0% |
Similar Demographics by 2nd Grade
Demographics Similar to Immigrants from Jordan by 2nd Grade
In terms of 2nd grade, the demographic groups most similar to Immigrants from Jordan are Ugandan (97.9%, a difference of 0.0%), Spanish American (97.9%, a difference of 0.0%), Chilean (97.9%, a difference of 0.0%), Brazilian (97.9%, a difference of 0.0%), and Immigrants from Spain (97.9%, a difference of 0.0%).
| Demographics | Rating | Rank | 2nd Grade |
| Comanche | 62.8 /100 | #159 | Good 97.9% |
| Immigrants | Eastern Europe | 61.1 /100 | #160 | Good 97.9% |
| Immigrants | Russia | 60.3 /100 | #161 | Good 97.9% |
| Immigrants | Italy | 60.2 /100 | #162 | Good 97.9% |
| Bermudans | 59.4 /100 | #163 | Average 97.9% |
| Ugandans | 56.6 /100 | #164 | Average 97.9% |
| Spanish Americans | 56.4 /100 | #165 | Average 97.9% |
| Immigrants | Jordan | 56.3 /100 | #166 | Average 97.9% |
| Chileans | 56.1 /100 | #167 | Average 97.9% |
| Brazilians | 55.8 /100 | #168 | Average 97.9% |
| Immigrants | Spain | 55.4 /100 | #169 | Average 97.9% |
| Navajo | 54.3 /100 | #170 | Average 97.9% |
| Albanians | 52.8 /100 | #171 | Average 97.9% |
| Immigrants | Korea | 52.7 /100 | #172 | Average 97.9% |
| Kenyans | 52.7 /100 | #173 | Average 97.9% |
Demographics Similar to Alaska Natives by 2nd Grade
In terms of 2nd grade, the demographic groups most similar to Alaska Natives are Norwegian (98.7%, a difference of 0.010%), German (98.7%, a difference of 0.030%), Slovak (98.7%, a difference of 0.030%), Alaskan Athabascan (98.7%, a difference of 0.040%), and Slovene (98.6%, a difference of 0.050%).
| Demographics | Rating | Rank | 2nd Grade |
| Crow | 100.0 /100 | #1 | Exceptional 99.6% |
| Yup'ik | 100.0 /100 | #2 | Exceptional 99.2% |
| Inupiat | 100.0 /100 | #3 | Exceptional 98.8% |
| Tsimshian | 100.0 /100 | #4 | Exceptional 98.8% |
| Alaskan Athabascans | 100.0 /100 | #5 | Exceptional 98.7% |
| Alaska Natives | 100.0 /100 | #6 | Exceptional 98.7% |
| Norwegians | 100.0 /100 | #7 | Exceptional 98.7% |
| Germans | 100.0 /100 | #8 | Exceptional 98.7% |
| Slovaks | 100.0 /100 | #9 | Exceptional 98.7% |
| Slovenes | 100.0 /100 | #10 | Exceptional 98.6% |
| Tlingit-Haida | 100.0 /100 | #11 | Exceptional 98.6% |
| Carpatho Rusyns | 100.0 /100 | #12 | Exceptional 98.6% |
| English | 100.0 /100 | #13 | Exceptional 98.6% |
| Swedes | 100.0 /100 | #14 | Exceptional 98.6% |
| Scottish | 100.0 /100 | #15 | Exceptional 98.6% |