Immigrants from Japan vs Immigrants from Brazil Kindergarten

COMPARE

Immigrants from Japan
Race
Ancestry
AfghanAfricanAlaska NativeAlaskan AthabascanAlbanianAleutAlsatianAmericanApacheArabArapahoArgentineanArmenianAssyrian/Chaldean/SyriacAustralianAustrianBahamianBangladeshiBarbadianBasqueBelgianBelizeanBermudanBhutaneseBlackfeetBolivianBrazilianBritishBritish West IndianBulgarianBurmeseCajunCambodianCanadianCape VerdeanCarpatho RusynCelticCentral AmericanCentral American IndianCherokeeCheyenneChickasawChileanChineseChippewaChoctawColombianColvilleComancheCosta RicanCreeCreekCroatianCrowCubanCypriotCzechCzechoslovakianDanishDelawareDominicanDutchDutch West IndianEastern EuropeanEcuadorianEgyptianEnglishEstonianEthiopianEuropeanFijianFilipinoFinnishFrenchFrench American IndianFrench CanadianGermanGerman RussianGhanaianGreekGuamanian/ChamorroGuatemalanGuyaneseHaitianHmongHonduranHopiHoumaHungarianIcelanderIndian (Asian)IndonesianInupiatIranianIraqiIrishIroquoisIsraeliItalianJamaicanJapaneseJordanianKenyanKiowaKoreanLaotianLatvianLebaneseLiberianLithuanianLumbeeLuxembourgerMacedonianMalaysianMalteseMarshalleseMenomineeMexicanMexican American IndianMongolianMoroccanNative HawaiianNavajoNepaleseNew ZealanderNicaraguanNigerianNorthern EuropeanNorwegianOkinawanOsageOttawaPaiutePakistaniPalestinianPanamanianParaguayanPennsylvania GermanPeruvianPimaPolishPortuguesePotawatomiPuebloPuerto RicanPuget Sound SalishRomanianRussianSalvadoranSamoanScandinavianScotch-IrishScottishSeminoleSenegaleseSerbianShoshoneSierra LeoneanSiouxSlavicSlovakSloveneSomaliSouth AfricanSouth AmericanSouth American IndianSoviet UnionSpaniardSpanishSpanish AmericanSpanish American IndianSri LankanSubsaharan AfricanSudaneseSwedishSwissSyrianTaiwaneseThaiTlingit-HaidaTohono O'OdhamTonganTrinidadian and TobagonianTsimshianTurkishU.S. Virgin IslanderUgandanUkrainianUruguayanUteVenezuelanVietnameseWelshWest IndianYakamaYaquiYugoslavianYumanYup'ikZimbabwean
Immigration
NonimmigrantsImmigrantsAfghanistanAfricaAlbaniaArgentinaArmeniaAsiaAustraliaAustriaBahamasBangladeshBarbadosBelarusBelgiumBelizeBoliviaBosnia and HerzegovinaBulgariaBurma/MyanmarCabo VerdeCambodiaCameroonCanadaCaribbeanCentral AmericaChileChinaColombiaCongoCosta RicaCroatiaCubaCzechoslovakiaDenmarkDominicaDominican RepublicEastern AfricaEastern AsiaEastern EuropeEcuadorEgyptEl SalvadorEnglandEritreaEthiopiaEuropeFijiFranceGermanyGhanaGreeceGrenadaGuatemalaGuyanaHaitiHondurasHong KongHungaryIndiaIndonesiaIranIraqIrelandIsraelItalyJamaicaJapanJordanKazakhstanKenyaKoreaKuwaitLaosLatin AmericaLatviaLebanonLiberiaLithuaniaMalaysiaMexicoMicronesiaMiddle AfricaMoldovaMoroccoNepalNetherlandsNicaraguaNigeriaNorth AmericaNorth MacedoniaNorthern AfricaNorthern EuropeNorwayOceaniaPakistanPanamaPeruPhilippinesPolandPortugalRomaniaRussiaSaudi ArabiaScotlandSenegalSerbiaSierra LeoneSingaporeSomaliaSouth AfricaSouth AmericaSouth Central AsiaSouth Eastern AsiaSouthern EuropeSpainSri LankaSt. Vincent and the GrenadinesSudanSwedenSwitzerlandSyriaTaiwanThailandTrinidad and TobagoTurkeyUgandaUkraineUruguayUzbekistanVenezuelaVietnamWest IndiesWestern AfricaWestern AsiaWestern EuropeYemenZaireZimbabweAzores
Immigrants from Brazil
Race
Ancestry
AfghanAfricanAlaska NativeAlaskan AthabascanAlbanianAleutAlsatianAmericanApacheArabArapahoArgentineanArmenianAssyrian/Chaldean/SyriacAustralianAustrianBahamianBangladeshiBarbadianBasqueBelgianBelizeanBermudanBhutaneseBlackfeetBolivianBrazilianBritishBritish West IndianBulgarianBurmeseCajunCambodianCanadianCape VerdeanCarpatho RusynCelticCentral AmericanCentral American IndianCherokeeCheyenneChickasawChileanChineseChippewaChoctawColombianColvilleComancheCosta RicanCreeCreekCroatianCrowCubanCypriotCzechCzechoslovakianDanishDelawareDominicanDutchDutch West IndianEastern EuropeanEcuadorianEgyptianEnglishEstonianEthiopianEuropeanFijianFilipinoFinnishFrenchFrench American IndianFrench CanadianGermanGerman RussianGhanaianGreekGuamanian/ChamorroGuatemalanGuyaneseHaitianHmongHonduranHopiHoumaHungarianIcelanderIndian (Asian)IndonesianInupiatIranianIraqiIrishIroquoisIsraeliItalianJamaicanJapaneseJordanianKenyanKiowaKoreanLaotianLatvianLebaneseLiberianLithuanianLumbeeLuxembourgerMacedonianMalaysianMalteseMarshalleseMenomineeMexicanMexican American IndianMongolianMoroccanNative HawaiianNavajoNepaleseNew ZealanderNicaraguanNigerianNorthern EuropeanNorwegianOkinawanOsageOttawaPaiutePakistaniPalestinianPanamanianParaguayanPennsylvania GermanPeruvianPimaPolishPortuguesePotawatomiPuebloPuerto RicanPuget Sound SalishRomanianRussianSalvadoranSamoanScandinavianScotch-IrishScottishSeminoleSenegaleseSerbianShoshoneSierra LeoneanSiouxSlavicSlovakSloveneSomaliSouth AfricanSouth AmericanSouth American IndianSoviet UnionSpaniardSpanishSpanish AmericanSpanish American IndianSri LankanSubsaharan AfricanSudaneseSwedishSwissSyrianTaiwaneseThaiTlingit-HaidaTohono O'OdhamTonganTrinidadian and TobagonianTsimshianTurkishU.S. Virgin IslanderUgandanUkrainianUruguayanUteVenezuelanVietnameseWelshWest IndianYakamaYaquiYugoslavianYumanYup'ikZimbabwean
Immigration
NonimmigrantsImmigrantsAfghanistanAfricaAlbaniaArgentinaArmeniaAsiaAustraliaAustriaBahamasBangladeshBarbadosBelarusBelgiumBelizeBoliviaBosnia and HerzegovinaBrazilBulgariaBurma/MyanmarCabo VerdeCambodiaCameroonCanadaCaribbeanCentral AmericaChileChinaColombiaCongoCosta RicaCroatiaCubaCzechoslovakiaDenmarkDominicaDominican RepublicEastern AfricaEastern AsiaEastern EuropeEcuadorEgyptEl SalvadorEnglandEritreaEthiopiaEuropeFijiFranceGermanyGhanaGreeceGrenadaGuatemalaGuyanaHaitiHondurasHong KongHungaryIndiaIndonesiaIranIraqIrelandIsraelItalyJamaicaJordanKazakhstanKenyaKoreaKuwaitLaosLatin AmericaLatviaLebanonLiberiaLithuaniaMalaysiaMexicoMicronesiaMiddle AfricaMoldovaMoroccoNepalNetherlandsNicaraguaNigeriaNorth AmericaNorth MacedoniaNorthern AfricaNorthern EuropeNorwayOceaniaPakistanPanamaPeruPhilippinesPolandPortugalRomaniaRussiaSaudi ArabiaScotlandSenegalSerbiaSierra LeoneSingaporeSomaliaSouth AfricaSouth AmericaSouth Central AsiaSouth Eastern AsiaSouthern EuropeSpainSri LankaSt. Vincent and the GrenadinesSudanSwedenSwitzerlandSyriaTaiwanThailandTrinidad and TobagoTurkeyUgandaUkraineUruguayUzbekistanVenezuelaVietnamWest IndiesWestern AfricaWestern AsiaWestern EuropeYemenZaireZimbabweAzores
Kindergarten
Income
Poverty
Unemployment
Labor Participation
Family Structure
Vehicle Availability
Education Level
Disability

Kindergarten Comparison

Immigrants from Japan

Immigrants from Brazil

Exceptional
Average
98.2%
KINDERGARTEN
94.0/ 100
METRIC RATING
122nd/ 347
METRIC RANK
98.0%
KINDERGARTEN
50.0/ 100
METRIC RATING
174th/ 347
METRIC RANK

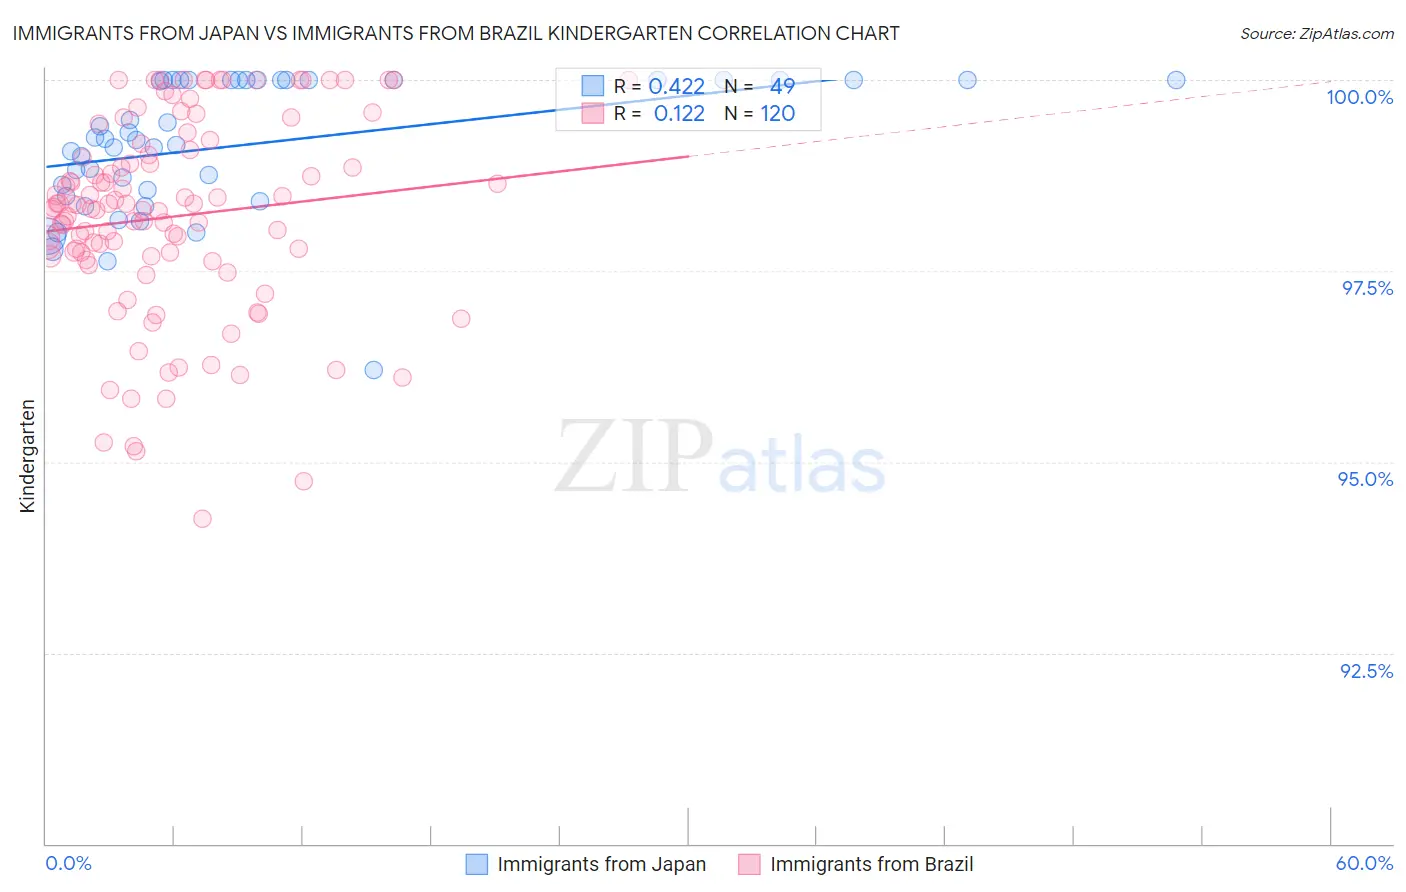
Immigrants from Japan vs Immigrants from Brazil Kindergarten Correlation Chart

The statistical analysis conducted on geographies consisting of 340,149,128 people shows a moderate positive correlation between the proportion of Immigrants from Japan and percentage of population with at least kindergarten education in the United States with a correlation coefficient (R) of 0.422 and weighted average of 98.2%. Similarly, the statistical analysis conducted on geographies consisting of 343,021,580 people shows a poor positive correlation between the proportion of Immigrants from Brazil and percentage of population with at least kindergarten education in the United States with a correlation coefficient (R) of 0.122 and weighted average of 98.0%, a difference of 0.21%.
Immigrants from Japan vs Immigrants from Brazil Kindergarten

Kindergarten Correlation Summary

MeasurementImmigrants from JapanImmigrants from Brazil
Minimum96.2%94.3%
Maximum100.0%100.0%
Range3.8%5.7%
Mean99.2%98.2%
Median99.2%98.3%
Interquartile 25% (IQ1)98.5%97.7%
Interquartile 75% (IQ3)100.0%99.1%
Interquartile Range (IQR)1.5%1.4%
Standard Deviation (Sample)0.87%1.3%
Standard Deviation (Population)0.86%1.3%

Similar Demographics by Kindergarten

Demographics Similar to Immigrants from Japan by Kindergarten

In terms of kindergarten, the demographic groups most similar to Immigrants from Japan are Immigrants from Zimbabwe (98.2%, a difference of 0.0%), Menominee (98.2%, a difference of 0.0%), Thai (98.2%, a difference of 0.010%), Okinawan (98.2%, a difference of 0.010%), and Syrian (98.2%, a difference of 0.010%).
DemographicsRating | RankKindergarten
Iranians
96.2
/100
|
#115
Exceptional
98.2%
Spanish
95.8
/100
|
#116
Exceptional
98.2%
Immigrants | France
95.5
/100
|
#117
Exceptional
98.2%
Yugoslavians
95.5
/100
|
#118
Exceptional
98.2%
Thais
94.8
/100
|
#119
Exceptional
98.2%
Okinawans
94.4
/100
|
#120
Exceptional
98.2%
Immigrants | Zimbabwe
94.0
/100
|
#121
Exceptional
98.2%
Immigrants | Japan
94.0
/100
|
#122
Exceptional
98.2%
Menominee
93.9
/100
|
#123
Exceptional
98.2%
Syrians
93.6
/100
|
#124
Exceptional
98.2%
Iroquois
93.5
/100
|
#125
Exceptional
98.2%
Lebanese
93.5
/100
|
#126
Exceptional
98.2%
Immigrants | Saudi Arabia
93.1
/100
|
#127
Exceptional
98.1%
Immigrants | Serbia
92.4
/100
|
#128
Exceptional
98.1%
Seminole
91.5
/100
|
#129
Exceptional
98.1%

Demographics Similar to Immigrants from Brazil by Kindergarten

In terms of kindergarten, the demographic groups most similar to Immigrants from Brazil are Native/Alaskan (98.0%, a difference of 0.0%), Kenyan (98.0%, a difference of 0.0%), Immigrants from Sri Lanka (97.9%, a difference of 0.0%), Albanian (97.9%, a difference of 0.0%), and Immigrants from Spain (98.0%, a difference of 0.010%).
DemographicsRating | RankKindergarten
Immigrants | Spain
54.6
/100
|
#167
Average
98.0%
Navajo
54.4
/100
|
#168
Average
98.0%
Immigrants | Korea
54.1
/100
|
#169
Average
98.0%
Bermudans
54.0
/100
|
#170
Average
98.0%
Immigrants | Jordan
54.0
/100
|
#171
Average
98.0%
Natives/Alaskans
51.0
/100
|
#172
Average
98.0%
Kenyans
51.0
/100
|
#173
Average
98.0%
Immigrants | Brazil
50.0
/100
|
#174
Average
98.0%
Immigrants | Sri Lanka
49.6
/100
|
#175
Average
97.9%
Albanians
48.5
/100
|
#176
Average
97.9%
Immigrants | Venezuela
47.9
/100
|
#177
Average
97.9%
Brazilians
47.6
/100
|
#178
Average
97.9%
Argentineans
46.8
/100
|
#179
Average
97.9%
Immigrants | Bosnia and Herzegovina
46.7
/100
|
#180
Average
97.9%
Portuguese
43.5
/100
|
#181
Average
97.9%