Immigrants from Japan vs Bermudan Master's Degree
COMPARE
Immigrants from Japan
Bermudan
Master's Degree
Master's Degree Comparison
Immigrants from Japan
Bermudans
20.0%
MASTER'S DEGREE
100.0/ 100
METRIC RATING
25th/ 347
METRIC RANK
15.4%
MASTER'S DEGREE
73.9/ 100
METRIC RATING
156th/ 347
METRIC RANK
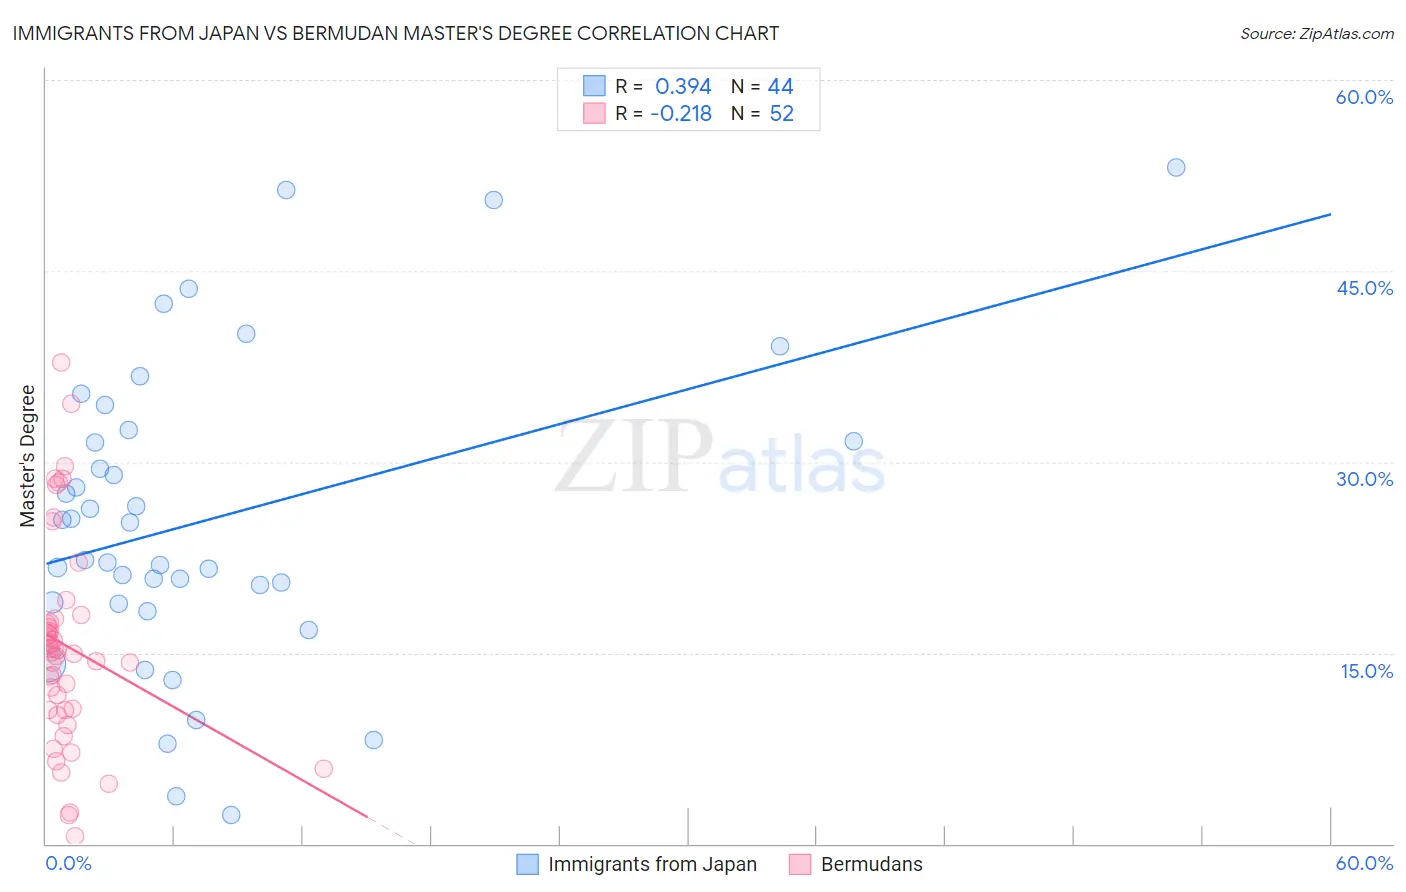
Immigrants from Japan vs Bermudan Master's Degree Correlation Chart
The statistical analysis conducted on geographies consisting of 340,075,167 people shows a mild positive correlation between the proportion of Immigrants from Japan and percentage of population with at least master's degree education in the United States with a correlation coefficient (R) of 0.394 and weighted average of 20.0%. Similarly, the statistical analysis conducted on geographies consisting of 55,727,694 people shows a weak negative correlation between the proportion of Bermudans and percentage of population with at least master's degree education in the United States with a correlation coefficient (R) of -0.218 and weighted average of 15.4%, a difference of 29.8%.
Master's Degree Correlation Summary
| Measurement | Immigrants from Japan | Bermudan |
| Minimum | 2.2% | 0.60% |
| Maximum | 53.1% | 37.8% |
| Range | 50.9% | 37.2% |
| Mean | 25.5% | 15.5% |
| Median | 23.8% | 15.1% |
| Interquartile 25% (IQ1) | 18.9% | 10.5% |
| Interquartile 75% (IQ3) | 32.1% | 17.5% |
| Interquartile Range (IQR) | 13.2% | 7.0% |
| Standard Deviation (Sample) | 12.0% | 8.1% |
| Standard Deviation (Population) | 11.9% | 8.0% |
Similar Demographics by Master's Degree
Demographics Similar to Immigrants from Japan by Master's Degree
In terms of master's degree, the demographic groups most similar to Immigrants from Japan are Cambodian (20.0%, a difference of 0.10%), Immigrants from Sri Lanka (19.9%, a difference of 0.51%), Turkish (19.9%, a difference of 0.58%), Latvian (19.8%, a difference of 0.99%), and Immigrants from Sweden (20.3%, a difference of 1.3%).
| Demographics | Rating | Rank | Master's Degree |
| Soviet Union | 100.0 /100 | #18 | Exceptional 20.5% |
| Immigrants | Hong Kong | 100.0 /100 | #19 | Exceptional 20.5% |
| Indians (Asian) | 100.0 /100 | #20 | Exceptional 20.5% |
| Immigrants | Ireland | 100.0 /100 | #21 | Exceptional 20.4% |
| Israelis | 100.0 /100 | #22 | Exceptional 20.3% |
| Immigrants | France | 100.0 /100 | #23 | Exceptional 20.3% |
| Immigrants | Sweden | 100.0 /100 | #24 | Exceptional 20.3% |
| Immigrants | Japan | 100.0 /100 | #25 | Exceptional 20.0% |
| Cambodians | 100.0 /100 | #26 | Exceptional 20.0% |
| Immigrants | Sri Lanka | 100.0 /100 | #27 | Exceptional 19.9% |
| Turks | 100.0 /100 | #28 | Exceptional 19.9% |
| Latvians | 100.0 /100 | #29 | Exceptional 19.8% |
| Immigrants | Turkey | 100.0 /100 | #30 | Exceptional 19.7% |
| Immigrants | Korea | 100.0 /100 | #31 | Exceptional 19.7% |
| Burmese | 100.0 /100 | #32 | Exceptional 19.7% |
Demographics Similar to Bermudans by Master's Degree
In terms of master's degree, the demographic groups most similar to Bermudans are Immigrants from Cameroon (15.4%, a difference of 0.35%), Immigrants from Bangladesh (15.5%, a difference of 0.36%), Immigrants from Poland (15.4%, a difference of 0.39%), Immigrants from South America (15.5%, a difference of 0.40%), and Luxembourger (15.3%, a difference of 0.45%).
| Demographics | Rating | Rank | Master's Degree |
| Ghanaians | 78.2 /100 | #149 | Good 15.5% |
| Slovenes | 78.0 /100 | #150 | Good 15.5% |
| Iraqis | 77.3 /100 | #151 | Good 15.5% |
| Slavs | 77.0 /100 | #152 | Good 15.5% |
| Icelanders | 76.8 /100 | #153 | Good 15.5% |
| Immigrants | South America | 76.3 /100 | #154 | Good 15.5% |
| Immigrants | Bangladesh | 76.1 /100 | #155 | Good 15.5% |
| Bermudans | 73.9 /100 | #156 | Good 15.4% |
| Immigrants | Cameroon | 71.7 /100 | #157 | Good 15.4% |
| Immigrants | Poland | 71.5 /100 | #158 | Good 15.4% |
| Luxembourgers | 71.0 /100 | #159 | Good 15.3% |
| Kenyans | 70.3 /100 | #160 | Good 15.3% |
| Sudanese | 68.7 /100 | #161 | Good 15.3% |
| Peruvians | 68.7 /100 | #162 | Good 15.3% |
| Uruguayans | 67.1 /100 | #163 | Good 15.3% |