Immigrants from Jamaica vs Yakama Nursery School
COMPARE
Immigrants from Jamaica
Yakama
Nursery School
Nursery School Comparison
Immigrants from Jamaica
Yakama
97.5%
NURSERY SCHOOL
0.2/ 100
METRIC RATING
270th/ 347
METRIC RANK
96.6%
NURSERY SCHOOL
0.0/ 100
METRIC RATING
332nd/ 347
METRIC RANK
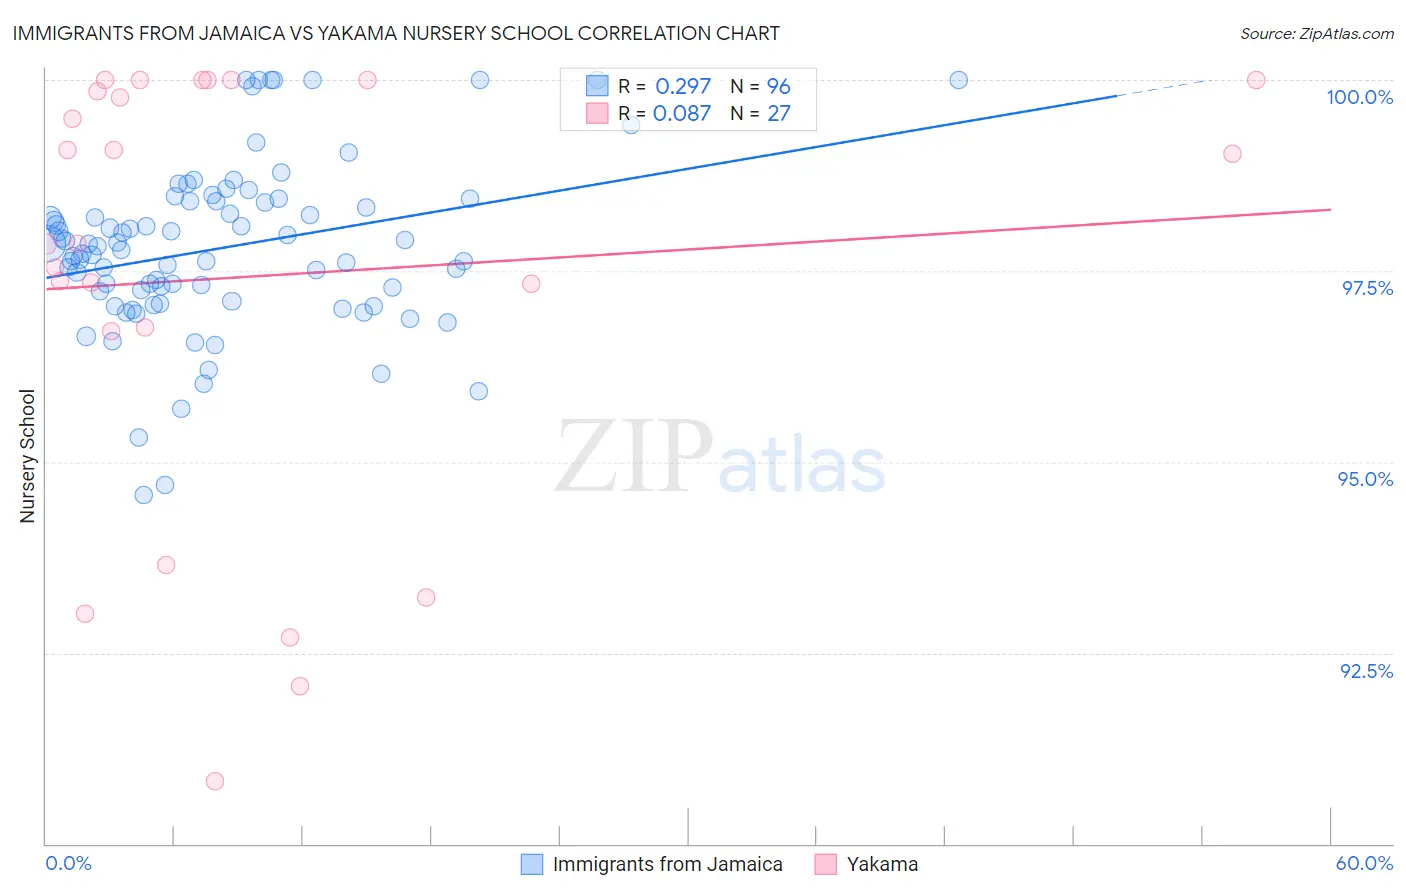
Immigrants from Jamaica vs Yakama Nursery School Correlation Chart
The statistical analysis conducted on geographies consisting of 301,830,081 people shows a weak positive correlation between the proportion of Immigrants from Jamaica and percentage of population with at least nursery school education in the United States with a correlation coefficient (R) of 0.297 and weighted average of 97.5%. Similarly, the statistical analysis conducted on geographies consisting of 19,923,144 people shows a slight positive correlation between the proportion of Yakama and percentage of population with at least nursery school education in the United States with a correlation coefficient (R) of 0.087 and weighted average of 96.6%, a difference of 0.91%.
Nursery School Correlation Summary
| Measurement | Immigrants from Jamaica | Yakama |
| Minimum | 94.6% | 90.8% |
| Maximum | 100.0% | 100.0% |
| Range | 5.4% | 9.2% |
| Mean | 97.8% | 97.4% |
| Median | 97.8% | 97.9% |
| Interquartile 25% (IQ1) | 97.2% | 96.7% |
| Interquartile 75% (IQ3) | 98.4% | 100.0% |
| Interquartile Range (IQR) | 1.3% | 3.3% |
| Standard Deviation (Sample) | 1.1% | 2.9% |
| Standard Deviation (Population) | 1.1% | 2.8% |
Similar Demographics by Nursery School
Demographics Similar to Immigrants from Jamaica by Nursery School
In terms of nursery school, the demographic groups most similar to Immigrants from Jamaica are West Indian (97.5%, a difference of 0.010%), Immigrants from Liberia (97.5%, a difference of 0.010%), Immigrants from Nigeria (97.5%, a difference of 0.020%), Immigrants from Peru (97.5%, a difference of 0.020%), and Taiwanese (97.6%, a difference of 0.030%).
| Demographics | Rating | Rank | Nursery School |
| Fijians | 0.3 /100 | #263 | Tragic 97.6% |
| Taiwanese | 0.3 /100 | #264 | Tragic 97.6% |
| Assyrians/Chaldeans/Syriacs | 0.3 /100 | #265 | Tragic 97.6% |
| Immigrants | Sierra Leone | 0.3 /100 | #266 | Tragic 97.6% |
| Immigrants | Nigeria | 0.3 /100 | #267 | Tragic 97.5% |
| West Indians | 0.3 /100 | #268 | Tragic 97.5% |
| Immigrants | Liberia | 0.3 /100 | #269 | Tragic 97.5% |
| Immigrants | Jamaica | 0.2 /100 | #270 | Tragic 97.5% |
| Immigrants | Peru | 0.2 /100 | #271 | Tragic 97.5% |
| Immigrants | Bolivia | 0.1 /100 | #272 | Tragic 97.5% |
| Immigrants | China | 0.1 /100 | #273 | Tragic 97.5% |
| Immigrants | Cameroon | 0.1 /100 | #274 | Tragic 97.5% |
| Ghanaians | 0.1 /100 | #275 | Tragic 97.5% |
| Immigrants | Philippines | 0.1 /100 | #276 | Tragic 97.5% |
| Immigrants | Western Africa | 0.1 /100 | #277 | Tragic 97.4% |
Demographics Similar to Yakama by Nursery School
In terms of nursery school, the demographic groups most similar to Yakama are Immigrants from Armenia (96.7%, a difference of 0.020%), Central American (96.6%, a difference of 0.020%), Immigrants from Dominican Republic (96.6%, a difference of 0.030%), Japanese (96.7%, a difference of 0.040%), and Immigrants from Vietnam (96.7%, a difference of 0.050%).
| Demographics | Rating | Rank | Nursery School |
| Dominicans | 0.0 /100 | #325 | Tragic 96.8% |
| Indonesians | 0.0 /100 | #326 | Tragic 96.8% |
| Mexicans | 0.0 /100 | #327 | Tragic 96.8% |
| Immigrants | Latin America | 0.0 /100 | #328 | Tragic 96.7% |
| Immigrants | Vietnam | 0.0 /100 | #329 | Tragic 96.7% |
| Japanese | 0.0 /100 | #330 | Tragic 96.7% |
| Immigrants | Armenia | 0.0 /100 | #331 | Tragic 96.7% |
| Yakama | 0.0 /100 | #332 | Tragic 96.6% |
| Central Americans | 0.0 /100 | #333 | Tragic 96.6% |
| Immigrants | Dominican Republic | 0.0 /100 | #334 | Tragic 96.6% |
| Bangladeshis | 0.0 /100 | #335 | Tragic 96.6% |
| Guatemalans | 0.0 /100 | #336 | Tragic 96.6% |
| Immigrants | Cambodia | 0.0 /100 | #337 | Tragic 96.5% |
| Immigrants | Fiji | 0.0 /100 | #338 | Tragic 96.5% |
| Immigrants | Guatemala | 0.0 /100 | #339 | Tragic 96.4% |