Immigrants from Jamaica vs Immigrants from Costa Rica 2nd Grade
COMPARE
Immigrants from Jamaica
Immigrants from Costa Rica
2nd Grade
2nd Grade Comparison
Immigrants from Jamaica
Immigrants from Costa Rica
97.4%
2ND GRADE
0.2/ 100
METRIC RATING
270th/ 347
METRIC RANK
97.6%
2ND GRADE
3.1/ 100
METRIC RATING
229th/ 347
METRIC RANK
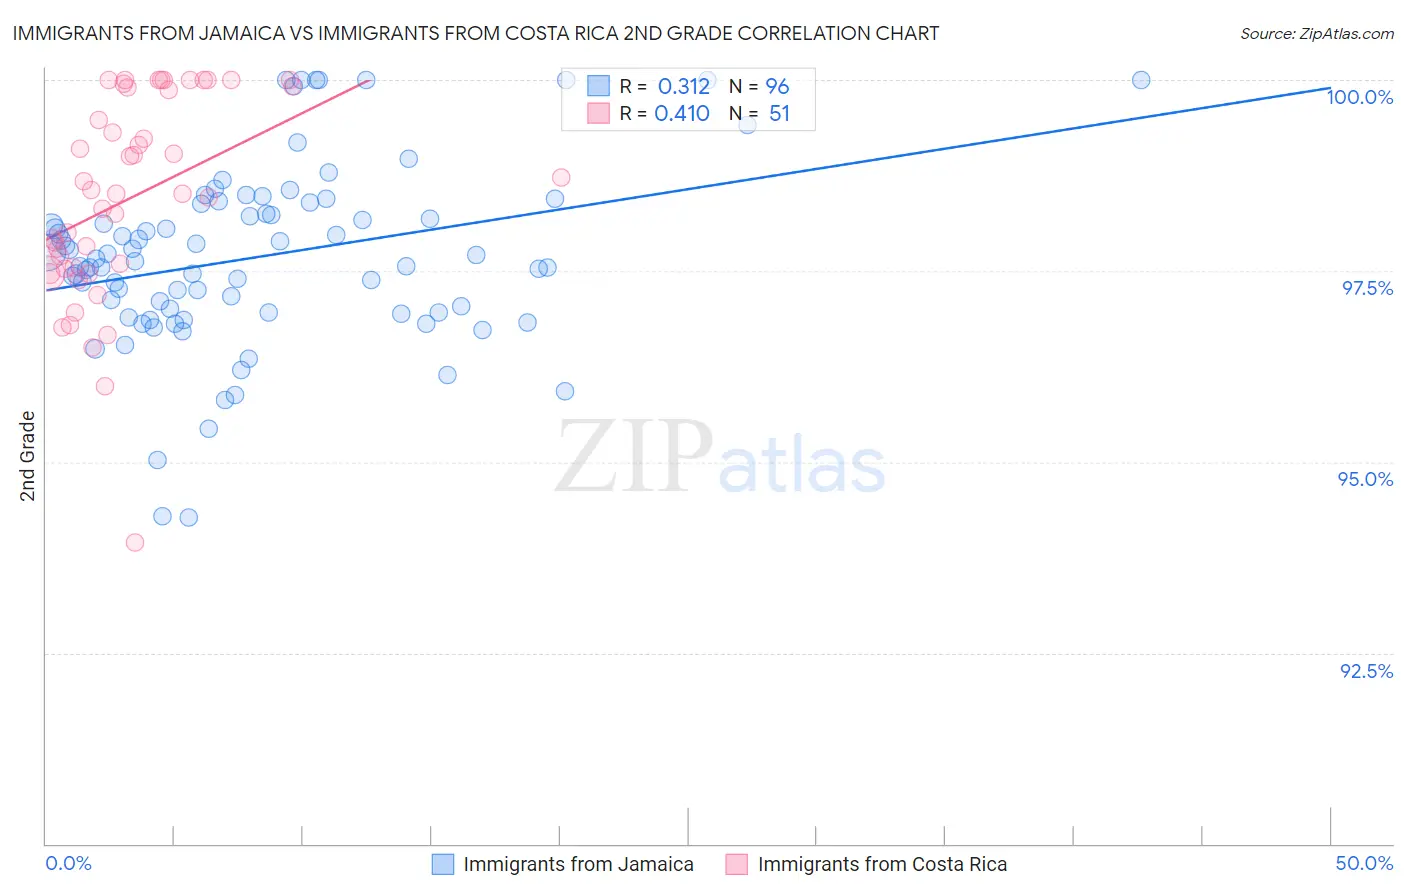
Immigrants from Jamaica vs Immigrants from Costa Rica 2nd Grade Correlation Chart
The statistical analysis conducted on geographies consisting of 301,830,081 people shows a mild positive correlation between the proportion of Immigrants from Jamaica and percentage of population with at least 2nd grade education in the United States with a correlation coefficient (R) of 0.312 and weighted average of 97.4%. Similarly, the statistical analysis conducted on geographies consisting of 204,275,869 people shows a moderate positive correlation between the proportion of Immigrants from Costa Rica and percentage of population with at least 2nd grade education in the United States with a correlation coefficient (R) of 0.410 and weighted average of 97.6%, a difference of 0.21%.
2nd Grade Correlation Summary
| Measurement | Immigrants from Jamaica | Immigrants from Costa Rica |
| Minimum | 94.3% | 93.9% |
| Maximum | 100.0% | 100.0% |
| Range | 5.7% | 6.1% |
| Mean | 97.7% | 98.5% |
| Median | 97.6% | 98.5% |
| Interquartile 25% (IQ1) | 97.0% | 97.5% |
| Interquartile 75% (IQ3) | 98.3% | 99.9% |
| Interquartile Range (IQR) | 1.3% | 2.4% |
| Standard Deviation (Sample) | 1.2% | 1.3% |
| Standard Deviation (Population) | 1.2% | 1.3% |
Similar Demographics by 2nd Grade
Demographics Similar to Immigrants from Jamaica by 2nd Grade
In terms of 2nd grade, the demographic groups most similar to Immigrants from Jamaica are Cuban (97.4%, a difference of 0.020%), Immigrants from Nigeria (97.4%, a difference of 0.020%), West Indian (97.4%, a difference of 0.020%), Immigrants from Cameroon (97.4%, a difference of 0.020%), and Immigrants from Peru (97.4%, a difference of 0.030%).
| Demographics | Rating | Rank | 2nd Grade |
| Immigrants | Ethiopia | 0.4 /100 | #263 | Tragic 97.4% |
| Immigrants | Liberia | 0.4 /100 | #264 | Tragic 97.4% |
| Immigrants | South America | 0.4 /100 | #265 | Tragic 97.4% |
| Immigrants | Sierra Leone | 0.4 /100 | #266 | Tragic 97.4% |
| Cubans | 0.3 /100 | #267 | Tragic 97.4% |
| Immigrants | Nigeria | 0.3 /100 | #268 | Tragic 97.4% |
| West Indians | 0.3 /100 | #269 | Tragic 97.4% |
| Immigrants | Jamaica | 0.2 /100 | #270 | Tragic 97.4% |
| Immigrants | Cameroon | 0.2 /100 | #271 | Tragic 97.4% |
| Immigrants | Peru | 0.1 /100 | #272 | Tragic 97.4% |
| Immigrants | Bolivia | 0.1 /100 | #273 | Tragic 97.4% |
| Ghanaians | 0.1 /100 | #274 | Tragic 97.4% |
| Immigrants | China | 0.1 /100 | #275 | Tragic 97.3% |
| Immigrants | Philippines | 0.1 /100 | #276 | Tragic 97.3% |
| Immigrants | Western Africa | 0.1 /100 | #277 | Tragic 97.3% |
Demographics Similar to Immigrants from Costa Rica by 2nd Grade
In terms of 2nd grade, the demographic groups most similar to Immigrants from Costa Rica are Senegalese (97.6%, a difference of 0.0%), Subsaharan African (97.6%, a difference of 0.010%), Immigrants from Syria (97.6%, a difference of 0.020%), Immigrants from Nepal (97.6%, a difference of 0.020%), and Immigrants from Pakistan (97.6%, a difference of 0.020%).
| Demographics | Rating | Rank | 2nd Grade |
| Immigrants | Sudan | 4.5 /100 | #222 | Tragic 97.6% |
| Sierra Leoneans | 4.3 /100 | #223 | Tragic 97.6% |
| Immigrants | Zaire | 4.3 /100 | #224 | Tragic 97.6% |
| Tongans | 4.3 /100 | #225 | Tragic 97.6% |
| Immigrants | Syria | 4.0 /100 | #226 | Tragic 97.6% |
| Immigrants | Nepal | 4.0 /100 | #227 | Tragic 97.6% |
| Sub-Saharan Africans | 3.4 /100 | #228 | Tragic 97.6% |
| Immigrants | Costa Rica | 3.1 /100 | #229 | Tragic 97.6% |
| Senegalese | 3.1 /100 | #230 | Tragic 97.6% |
| Immigrants | Pakistan | 2.3 /100 | #231 | Tragic 97.6% |
| Immigrants | Western Asia | 2.1 /100 | #232 | Tragic 97.6% |
| Immigrants | Uruguay | 2.1 /100 | #233 | Tragic 97.6% |
| Immigrants | Malaysia | 2.0 /100 | #234 | Tragic 97.6% |
| Colombians | 1.9 /100 | #235 | Tragic 97.6% |
| Nigerians | 1.7 /100 | #236 | Tragic 97.6% |