Immigrants from Israel vs Ute Doctorate Degree

COMPARE

Immigrants from Israel
Race
Ancestry
AfghanAfricanAlaska NativeAlaskan AthabascanAlbanianAleutAlsatianAmericanApacheArabArapahoArgentineanArmenianAssyrian/Chaldean/SyriacAustralianAustrianBahamianBangladeshiBarbadianBasqueBelgianBelizeanBermudanBhutaneseBlackfeetBolivianBrazilianBritishBritish West IndianBulgarianBurmeseCajunCambodianCanadianCape VerdeanCarpatho RusynCelticCentral AmericanCentral American IndianCherokeeCheyenneChickasawChileanChineseChippewaChoctawColombianColvilleComancheCosta RicanCreeCreekCroatianCrowCubanCypriotCzechCzechoslovakianDanishDelawareDominicanDutchDutch West IndianEastern EuropeanEcuadorianEgyptianEnglishEstonianEthiopianEuropeanFijianFilipinoFinnishFrenchFrench American IndianFrench CanadianGermanGerman RussianGhanaianGreekGuamanian/ChamorroGuatemalanGuyaneseHaitianHmongHonduranHopiHoumaHungarianIcelanderIndian (Asian)IndonesianInupiatIranianIraqiIrishIroquoisIsraeliItalianJamaicanJapaneseJordanianKenyanKiowaKoreanLaotianLatvianLebaneseLiberianLithuanianLumbeeLuxembourgerMacedonianMalaysianMalteseMarshalleseMenomineeMexicanMexican American IndianMongolianMoroccanNative HawaiianNavajoNepaleseNew ZealanderNicaraguanNigerianNorthern EuropeanNorwegianOkinawanOsageOttawaPaiutePakistaniPalestinianPanamanianParaguayanPennsylvania GermanPeruvianPimaPolishPortuguesePotawatomiPuebloPuerto RicanPuget Sound SalishRomanianRussianSalvadoranSamoanScandinavianScotch-IrishScottishSeminoleSenegaleseSerbianShoshoneSierra LeoneanSiouxSlavicSlovakSloveneSomaliSouth AfricanSouth AmericanSouth American IndianSoviet UnionSpaniardSpanishSpanish AmericanSpanish American IndianSri LankanSubsaharan AfricanSudaneseSwedishSwissSyrianTaiwaneseThaiTlingit-HaidaTohono O'OdhamTonganTrinidadian and TobagonianTsimshianTurkishU.S. Virgin IslanderUgandanUkrainianUruguayanVenezuelanVietnameseWelshWest IndianYakamaYaquiYugoslavianYumanYup'ikZimbabwean
Immigration
NonimmigrantsImmigrantsAfghanistanAfricaAlbaniaArgentinaArmeniaAsiaAustraliaAustriaBahamasBangladeshBarbadosBelarusBelgiumBelizeBoliviaBosnia and HerzegovinaBrazilBulgariaBurma/MyanmarCabo VerdeCambodiaCameroonCanadaCaribbeanCentral AmericaChileChinaColombiaCongoCosta RicaCroatiaCubaCzechoslovakiaDenmarkDominicaDominican RepublicEastern AfricaEastern AsiaEastern EuropeEcuadorEgyptEl SalvadorEnglandEritreaEthiopiaEuropeFijiFranceGermanyGhanaGreeceGrenadaGuatemalaGuyanaHaitiHondurasHong KongHungaryIndiaIndonesiaIranIraqIrelandIsraelItalyJamaicaJapanJordanKazakhstanKenyaKoreaKuwaitLaosLatin AmericaLatviaLebanonLiberiaLithuaniaMalaysiaMexicoMicronesiaMiddle AfricaMoldovaMoroccoNepalNetherlandsNicaraguaNigeriaNorth AmericaNorth MacedoniaNorthern AfricaNorthern EuropeNorwayOceaniaPakistanPanamaPeruPhilippinesPolandPortugalRomaniaRussiaSaudi ArabiaScotlandSenegalSerbiaSierra LeoneSingaporeSomaliaSouth AfricaSouth AmericaSouth Central AsiaSouth Eastern AsiaSouthern EuropeSpainSri LankaSt. Vincent and the GrenadinesSudanSwedenSwitzerlandSyriaTaiwanThailandTrinidad and TobagoTurkeyUgandaUkraineUruguayUzbekistanVenezuelaVietnamWest IndiesWestern AfricaWestern AsiaWestern EuropeYemenZaireZimbabweAzores
Ute
Race
Ancestry
AfghanAfricanAlaska NativeAlaskan AthabascanAlbanianAleutAlsatianAmericanApacheArabArapahoArgentineanArmenianAssyrian/Chaldean/SyriacAustralianAustrianBahamianBangladeshiBarbadianBasqueBelgianBelizeanBermudanBhutaneseBlackfeetBolivianBrazilianBritishBritish West IndianBulgarianBurmeseCajunCambodianCanadianCape VerdeanCarpatho RusynCelticCentral AmericanCentral American IndianCherokeeCheyenneChickasawChileanChineseChippewaChoctawColombianColvilleComancheCosta RicanCreeCreekCroatianCrowCubanCypriotCzechCzechoslovakianDanishDelawareDominicanDutchDutch West IndianEastern EuropeanEcuadorianEgyptianEnglishEstonianEthiopianEuropeanFijianFilipinoFinnishFrenchFrench American IndianFrench CanadianGermanGerman RussianGhanaianGreekGuamanian/ChamorroGuatemalanGuyaneseHaitianHmongHonduranHopiHoumaHungarianIcelanderIndian (Asian)IndonesianInupiatIranianIraqiIrishIroquoisIsraeliItalianJamaicanJapaneseJordanianKenyanKiowaKoreanLaotianLatvianLebaneseLiberianLithuanianLumbeeLuxembourgerMacedonianMalaysianMalteseMarshalleseMenomineeMexicanMexican American IndianMongolianMoroccanNative HawaiianNavajoNepaleseNew ZealanderNicaraguanNigerianNorthern EuropeanNorwegianOkinawanOsageOttawaPaiutePakistaniPalestinianPanamanianParaguayanPennsylvania GermanPeruvianPimaPolishPortuguesePotawatomiPuebloPuerto RicanPuget Sound SalishRomanianRussianSalvadoranSamoanScandinavianScotch-IrishScottishSeminoleSenegaleseSerbianShoshoneSierra LeoneanSiouxSlavicSlovakSloveneSomaliSouth AfricanSouth AmericanSouth American IndianSoviet UnionSpaniardSpanishSpanish AmericanSpanish American IndianSri LankanSubsaharan AfricanSudaneseSwedishSwissSyrianTaiwaneseThaiTlingit-HaidaTohono O'OdhamTonganTrinidadian and TobagonianTsimshianTurkishU.S. Virgin IslanderUgandanUkrainianUruguayanUteVenezuelanVietnameseWelshWest IndianYakamaYaquiYugoslavianYumanYup'ikZimbabwean
Immigration
NonimmigrantsImmigrantsAfghanistanAfricaAlbaniaArgentinaArmeniaAsiaAustraliaAustriaBahamasBangladeshBarbadosBelarusBelgiumBelizeBoliviaBosnia and HerzegovinaBrazilBulgariaBurma/MyanmarCabo VerdeCambodiaCameroonCanadaCaribbeanCentral AmericaChileChinaColombiaCongoCosta RicaCroatiaCubaCzechoslovakiaDenmarkDominicaDominican RepublicEastern AfricaEastern AsiaEastern EuropeEcuadorEgyptEl SalvadorEnglandEritreaEthiopiaEuropeFijiFranceGermanyGhanaGreeceGrenadaGuatemalaGuyanaHaitiHondurasHong KongHungaryIndiaIndonesiaIranIraqIrelandItalyJamaicaJapanJordanKazakhstanKenyaKoreaKuwaitLaosLatin AmericaLatviaLebanonLiberiaLithuaniaMalaysiaMexicoMicronesiaMiddle AfricaMoldovaMoroccoNepalNetherlandsNicaraguaNigeriaNorth AmericaNorth MacedoniaNorthern AfricaNorthern EuropeNorwayOceaniaPakistanPanamaPeruPhilippinesPolandPortugalRomaniaRussiaSaudi ArabiaScotlandSenegalSerbiaSierra LeoneSingaporeSomaliaSouth AfricaSouth AmericaSouth Central AsiaSouth Eastern AsiaSouthern EuropeSpainSri LankaSt. Vincent and the GrenadinesSudanSwedenSwitzerlandSyriaTaiwanThailandTrinidad and TobagoTurkeyUgandaUkraineUruguayUzbekistanVenezuelaVietnamWest IndiesWestern AfricaWestern AsiaWestern EuropeYemenZaireZimbabweAzores
Doctorate Degree
Income
Poverty
Unemployment
Labor Participation
Family Structure
Vehicle Availability
Education Level
Disability

Doctorate Degree Comparison

Immigrants from Israel

Ute

Exceptional
Exceptional
3.0%
DOCTORATE DEGREE
100.0/ 100
METRIC RATING
8th/ 347
METRIC RANK
2.0%
DOCTORATE DEGREE
93.2/ 100
METRIC RATING
124th/ 347
METRIC RANK

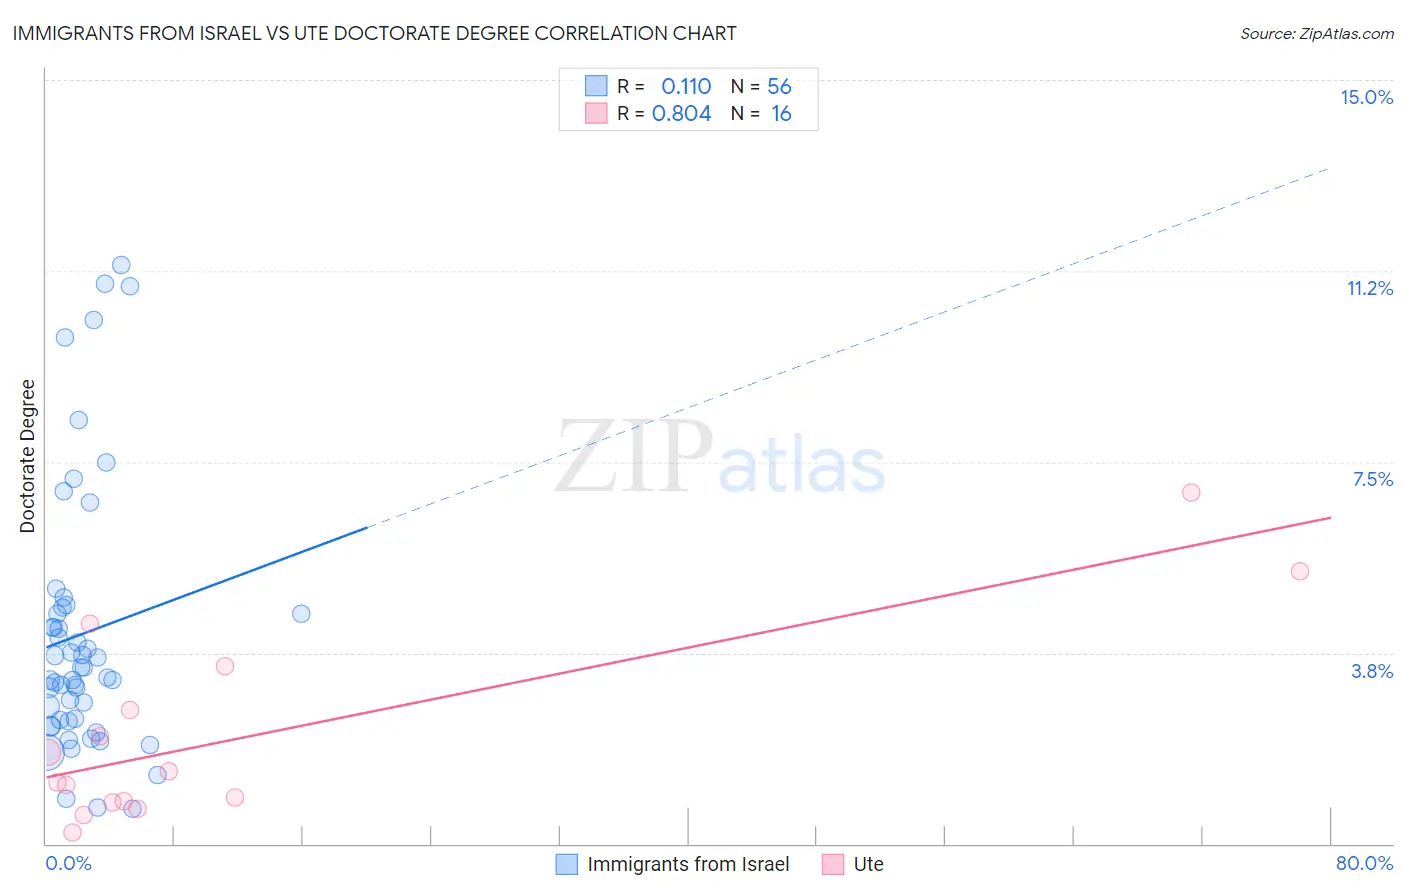
Immigrants from Israel vs Ute Doctorate Degree Correlation Chart

The statistical analysis conducted on geographies consisting of 209,560,574 people shows a poor positive correlation between the proportion of Immigrants from Israel and percentage of population with at least doctorate degree education in the United States with a correlation coefficient (R) of 0.110 and weighted average of 3.0%. Similarly, the statistical analysis conducted on geographies consisting of 55,479,547 people shows a very strong positive correlation between the proportion of Ute and percentage of population with at least doctorate degree education in the United States with a correlation coefficient (R) of 0.804 and weighted average of 2.0%, a difference of 51.2%.
Immigrants from Israel vs Ute Doctorate Degree

Doctorate Degree Correlation Summary

MeasurementImmigrants from IsraelUte
Minimum0.70%0.23%
Maximum11.4%6.9%
Range10.7%6.7%
Mean4.1%2.1%
Median3.4%1.3%
Interquartile 25% (IQ1)2.4%0.83%
Interquartile 75% (IQ3)4.6%3.1%
Interquartile Range (IQR)2.2%2.2%
Standard Deviation (Sample)2.6%1.9%
Standard Deviation (Population)2.6%1.9%

Similar Demographics by Doctorate Degree

Demographics Similar to Immigrants from Israel by Doctorate Degree

In terms of doctorate degree, the demographic groups most similar to Immigrants from Israel are Immigrants from Iran (3.0%, a difference of 0.67%), Immigrants from China (3.1%, a difference of 1.3%), Immigrants from Switzerland (3.1%, a difference of 1.4%), Immigrants from Eastern Asia (3.0%, a difference of 2.8%), and Iranian (3.1%, a difference of 3.3%).
DemographicsRating | RankDoctorate Degree
Immigrants | Singapore
100.0
/100
|
#1
Exceptional
3.7%
Filipinos
100.0
/100
|
#2
Exceptional
3.4%
Okinawans
100.0
/100
|
#3
Exceptional
3.3%
Immigrants | Taiwan
100.0
/100
|
#4
Exceptional
3.2%
Iranians
100.0
/100
|
#5
Exceptional
3.1%
Immigrants | Switzerland
100.0
/100
|
#6
Exceptional
3.1%
Immigrants | China
100.0
/100
|
#7
Exceptional
3.1%
Immigrants | Israel
100.0
/100
|
#8
Exceptional
3.0%
Immigrants | Iran
100.0
/100
|
#9
Exceptional
3.0%
Immigrants | Eastern Asia
100.0
/100
|
#10
Exceptional
3.0%
Indians (Asian)
100.0
/100
|
#11
Exceptional
2.9%
Immigrants | Belgium
100.0
/100
|
#12
Exceptional
2.9%
Immigrants | Sweden
100.0
/100
|
#13
Exceptional
2.9%
Immigrants | France
100.0
/100
|
#14
Exceptional
2.9%
Immigrants | India
100.0
/100
|
#15
Exceptional
2.8%

Demographics Similar to Ute by Doctorate Degree

In terms of doctorate degree, the demographic groups most similar to Ute are Moroccan (2.0%, a difference of 0.11%), Croatian (2.0%, a difference of 0.47%), Jordanian (2.0%, a difference of 0.52%), Palestinian (2.0%, a difference of 0.56%), and Immigrants from Southern Europe (2.0%, a difference of 0.93%).
DemographicsRating | RankDoctorate Degree
Lebanese
96.0
/100
|
#117
Exceptional
2.1%
Icelanders
96.0
/100
|
#118
Exceptional
2.1%
Pakistanis
95.8
/100
|
#119
Exceptional
2.0%
Immigrants | Morocco
95.5
/100
|
#120
Exceptional
2.0%
Immigrants | Jordan
94.8
/100
|
#121
Exceptional
2.0%
Immigrants | Southern Europe
94.7
/100
|
#122
Exceptional
2.0%
Croatians
94.0
/100
|
#123
Exceptional
2.0%
Ute
93.2
/100
|
#124
Exceptional
2.0%
Moroccans
93.0
/100
|
#125
Exceptional
2.0%
Jordanians
92.1
/100
|
#126
Exceptional
2.0%
Palestinians
92.0
/100
|
#127
Exceptional
2.0%
Immigrants | Zaire
91.1
/100
|
#128
Exceptional
2.0%
Canadians
90.6
/100
|
#129
Exceptional
2.0%
Immigrants | Ukraine
90.5
/100
|
#130
Exceptional
2.0%
Immigrants | Sierra Leone
90.2
/100
|
#131
Exceptional
2.0%