Immigrants from Israel vs Immigrants from Vietnam 4th Grade

COMPARE

Immigrants from Israel
Race
Ancestry
AfghanAfricanAlaska NativeAlaskan AthabascanAlbanianAleutAlsatianAmericanApacheArabArapahoArgentineanArmenianAssyrian/Chaldean/SyriacAustralianAustrianBahamianBangladeshiBarbadianBasqueBelgianBelizeanBermudanBhutaneseBlackfeetBolivianBrazilianBritishBritish West IndianBulgarianBurmeseCajunCambodianCanadianCape VerdeanCarpatho RusynCelticCentral AmericanCentral American IndianCherokeeCheyenneChickasawChileanChineseChippewaChoctawColombianColvilleComancheCosta RicanCreeCreekCroatianCrowCubanCypriotCzechCzechoslovakianDanishDelawareDominicanDutchDutch West IndianEastern EuropeanEcuadorianEgyptianEnglishEstonianEthiopianEuropeanFijianFilipinoFinnishFrenchFrench American IndianFrench CanadianGermanGerman RussianGhanaianGreekGuamanian/ChamorroGuatemalanGuyaneseHaitianHmongHonduranHopiHoumaHungarianIcelanderIndian (Asian)IndonesianInupiatIranianIraqiIrishIroquoisIsraeliItalianJamaicanJapaneseJordanianKenyanKiowaKoreanLaotianLatvianLebaneseLiberianLithuanianLumbeeLuxembourgerMacedonianMalaysianMalteseMarshalleseMenomineeMexicanMexican American IndianMongolianMoroccanNative HawaiianNavajoNepaleseNew ZealanderNicaraguanNigerianNorthern EuropeanNorwegianOkinawanOsageOttawaPaiutePakistaniPalestinianPanamanianParaguayanPennsylvania GermanPeruvianPimaPolishPortuguesePotawatomiPuebloPuerto RicanPuget Sound SalishRomanianRussianSalvadoranSamoanScandinavianScotch-IrishScottishSeminoleSenegaleseSerbianShoshoneSierra LeoneanSiouxSlavicSlovakSloveneSomaliSouth AfricanSouth AmericanSouth American IndianSoviet UnionSpaniardSpanishSpanish AmericanSpanish American IndianSri LankanSubsaharan AfricanSudaneseSwedishSwissSyrianTaiwaneseThaiTlingit-HaidaTohono O'OdhamTonganTrinidadian and TobagonianTsimshianTurkishU.S. Virgin IslanderUgandanUkrainianUruguayanUteVenezuelanVietnameseWelshWest IndianYakamaYaquiYugoslavianYumanYup'ikZimbabwean
Immigration
NonimmigrantsImmigrantsAfghanistanAfricaAlbaniaArgentinaArmeniaAsiaAustraliaAustriaBahamasBangladeshBarbadosBelarusBelgiumBelizeBoliviaBosnia and HerzegovinaBrazilBulgariaBurma/MyanmarCabo VerdeCambodiaCameroonCanadaCaribbeanCentral AmericaChileChinaColombiaCongoCosta RicaCroatiaCubaCzechoslovakiaDenmarkDominicaDominican RepublicEastern AfricaEastern AsiaEastern EuropeEcuadorEgyptEl SalvadorEnglandEritreaEthiopiaEuropeFijiFranceGermanyGhanaGreeceGrenadaGuatemalaGuyanaHaitiHondurasHong KongHungaryIndiaIndonesiaIranIraqIrelandIsraelItalyJamaicaJapanJordanKazakhstanKenyaKoreaKuwaitLaosLatin AmericaLatviaLebanonLiberiaLithuaniaMalaysiaMexicoMicronesiaMiddle AfricaMoldovaMoroccoNepalNetherlandsNicaraguaNigeriaNorth AmericaNorth MacedoniaNorthern AfricaNorthern EuropeNorwayOceaniaPakistanPanamaPeruPhilippinesPolandPortugalRomaniaRussiaSaudi ArabiaScotlandSenegalSerbiaSierra LeoneSingaporeSomaliaSouth AfricaSouth AmericaSouth Central AsiaSouth Eastern AsiaSouthern EuropeSpainSri LankaSt. Vincent and the GrenadinesSudanSwedenSwitzerlandSyriaTaiwanThailandTrinidad and TobagoTurkeyUgandaUkraineUruguayUzbekistanVenezuelaWest IndiesWestern AfricaWestern AsiaWestern EuropeYemenZaireZimbabweAzores
Immigrants from Vietnam
Race
Ancestry
AfghanAfricanAlaska NativeAlaskan AthabascanAlbanianAleutAlsatianAmericanApacheArabArapahoArgentineanArmenianAssyrian/Chaldean/SyriacAustralianAustrianBahamianBangladeshiBarbadianBasqueBelgianBelizeanBermudanBhutaneseBlackfeetBolivianBrazilianBritishBritish West IndianBulgarianBurmeseCajunCambodianCanadianCape VerdeanCarpatho RusynCelticCentral AmericanCentral American IndianCherokeeCheyenneChickasawChileanChineseChippewaChoctawColombianColvilleComancheCosta RicanCreeCreekCroatianCrowCubanCypriotCzechCzechoslovakianDanishDelawareDominicanDutchDutch West IndianEastern EuropeanEcuadorianEgyptianEnglishEstonianEthiopianEuropeanFijianFilipinoFinnishFrenchFrench American IndianFrench CanadianGermanGerman RussianGhanaianGreekGuamanian/ChamorroGuatemalanGuyaneseHaitianHmongHonduranHopiHoumaHungarianIcelanderIndian (Asian)IndonesianInupiatIranianIraqiIrishIroquoisIsraeliItalianJamaicanJapaneseJordanianKenyanKiowaKoreanLaotianLatvianLebaneseLiberianLithuanianLumbeeLuxembourgerMacedonianMalaysianMalteseMarshalleseMenomineeMexicanMexican American IndianMongolianMoroccanNative HawaiianNavajoNepaleseNew ZealanderNicaraguanNigerianNorthern EuropeanNorwegianOkinawanOsageOttawaPaiutePakistaniPalestinianPanamanianParaguayanPennsylvania GermanPeruvianPimaPolishPortuguesePotawatomiPuebloPuerto RicanPuget Sound SalishRomanianRussianSalvadoranSamoanScandinavianScotch-IrishScottishSeminoleSenegaleseSerbianShoshoneSierra LeoneanSiouxSlavicSlovakSloveneSomaliSouth AfricanSouth AmericanSouth American IndianSoviet UnionSpaniardSpanishSpanish AmericanSpanish American IndianSri LankanSubsaharan AfricanSudaneseSwedishSwissSyrianTaiwaneseThaiTlingit-HaidaTohono O'OdhamTonganTrinidadian and TobagonianTsimshianTurkishU.S. Virgin IslanderUgandanUkrainianUruguayanUteVenezuelanVietnameseWelshWest IndianYakamaYaquiYugoslavianYumanYup'ikZimbabwean
Immigration
NonimmigrantsImmigrantsAfghanistanAfricaAlbaniaArgentinaArmeniaAsiaAustraliaAustriaBahamasBangladeshBarbadosBelarusBelgiumBelizeBoliviaBosnia and HerzegovinaBrazilBulgariaBurma/MyanmarCabo VerdeCambodiaCameroonCanadaCaribbeanCentral AmericaChileChinaColombiaCongoCosta RicaCroatiaCubaCzechoslovakiaDenmarkDominicaDominican RepublicEastern AfricaEastern AsiaEastern EuropeEcuadorEgyptEl SalvadorEnglandEritreaEthiopiaEuropeFijiFranceGermanyGhanaGreeceGrenadaGuatemalaGuyanaHaitiHondurasHong KongHungaryIndiaIndonesiaIranIraqIrelandItalyJamaicaJapanJordanKazakhstanKenyaKoreaKuwaitLaosLatin AmericaLatviaLebanonLiberiaLithuaniaMalaysiaMexicoMicronesiaMiddle AfricaMoldovaMoroccoNepalNetherlandsNicaraguaNigeriaNorth AmericaNorth MacedoniaNorthern AfricaNorthern EuropeNorwayOceaniaPakistanPanamaPeruPhilippinesPolandPortugalRomaniaRussiaSaudi ArabiaScotlandSenegalSerbiaSierra LeoneSingaporeSomaliaSouth AfricaSouth AmericaSouth Central AsiaSouth Eastern AsiaSouthern EuropeSpainSri LankaSt. Vincent and the GrenadinesSudanSwedenSwitzerlandSyriaTaiwanThailandTrinidad and TobagoTurkeyUgandaUkraineUruguayUzbekistanVenezuelaVietnamWest IndiesWestern AfricaWestern AsiaWestern EuropeYemenZaireZimbabweAzores
4th Grade
Income
Poverty
Unemployment
Labor Participation
Family Structure
Vehicle Availability
Education Level
Disability

4th Grade Comparison

Immigrants from Israel

Immigrants from Vietnam

Good
Tragic
97.6%
4TH GRADE
77.7/ 100
METRIC RATING
150th/ 347
METRIC RANK
96.0%
4TH GRADE
0.0/ 100
METRIC RATING
322nd/ 347
METRIC RANK

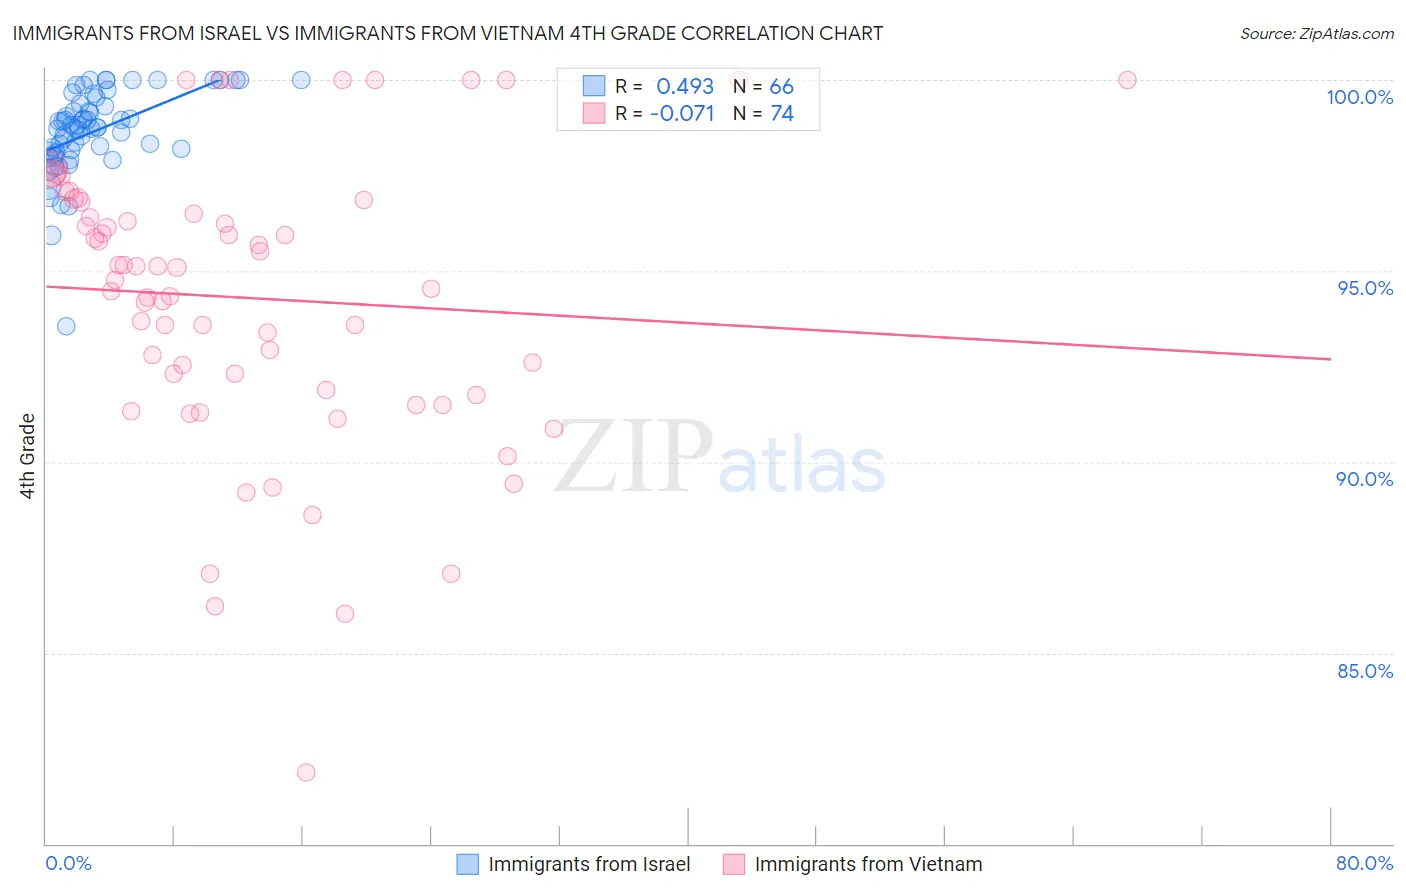
Immigrants from Israel vs Immigrants from Vietnam 4th Grade Correlation Chart

The statistical analysis conducted on geographies consisting of 210,029,773 people shows a moderate positive correlation between the proportion of Immigrants from Israel and percentage of population with at least 4th grade education in the United States with a correlation coefficient (R) of 0.493 and weighted average of 97.6%. Similarly, the statistical analysis conducted on geographies consisting of 404,844,130 people shows a slight negative correlation between the proportion of Immigrants from Vietnam and percentage of population with at least 4th grade education in the United States with a correlation coefficient (R) of -0.071 and weighted average of 96.0%, a difference of 1.7%.
Immigrants from Israel vs Immigrants from Vietnam 4th Grade

4th Grade Correlation Summary

MeasurementImmigrants from IsraelImmigrants from Vietnam
Minimum93.6%81.9%
Maximum100.0%100.0%
Range6.4%18.1%
Mean98.7%94.3%
Median98.8%94.9%
Interquartile 25% (IQ1)98.1%91.9%
Interquartile 75% (IQ3)99.4%96.8%
Interquartile Range (IQR)1.2%4.9%
Standard Deviation (Sample)1.1%3.8%
Standard Deviation (Population)1.1%3.7%

Similar Demographics by 4th Grade

Demographics Similar to Immigrants from Israel by 4th Grade

In terms of 4th grade, the demographic groups most similar to Immigrants from Israel are Soviet Union (97.6%, a difference of 0.0%), Alsatian (97.6%, a difference of 0.0%), Immigrants from South Central Asia (97.6%, a difference of 0.010%), Jordanian (97.7%, a difference of 0.020%), and Ute (97.7%, a difference of 0.020%).
DemographicsRating | Rank4th Grade
Burmese
82.8
/100
|
#143
Excellent
97.7%
Spaniards
82.7
/100
|
#144
Excellent
97.7%
Immigrants | Moldova
82.4
/100
|
#145
Excellent
97.7%
Jordanians
81.3
/100
|
#146
Excellent
97.7%
Ute
80.6
/100
|
#147
Excellent
97.7%
Hopi
80.6
/100
|
#148
Excellent
97.7%
Soviet Union
77.8
/100
|
#149
Good
97.6%
Immigrants | Israel
77.7
/100
|
#150
Good
97.6%
Alsatians
77.2
/100
|
#151
Good
97.6%
Immigrants | South Central Asia
76.2
/100
|
#152
Good
97.6%
Immigrants | Eastern Europe
71.3
/100
|
#153
Good
97.6%
Immigrants | Russia
67.0
/100
|
#154
Good
97.6%
Albanians
67.0
/100
|
#155
Good
97.6%
Immigrants | Jordan
66.9
/100
|
#156
Good
97.6%
Immigrants | Bosnia and Herzegovina
66.0
/100
|
#157
Good
97.6%

Demographics Similar to Immigrants from Vietnam by 4th Grade

In terms of 4th grade, the demographic groups most similar to Immigrants from Vietnam are Japanese (96.0%, a difference of 0.0%), Immigrants from Nicaragua (96.0%, a difference of 0.020%), Immigrants from Belize (96.0%, a difference of 0.030%), Dominican (96.0%, a difference of 0.040%), and Hispanic or Latino (96.0%, a difference of 0.050%).
DemographicsRating | Rank4th Grade
Nicaraguans
0.0
/100
|
#315
Tragic
96.2%
Immigrants | Ecuador
0.0
/100
|
#316
Tragic
96.2%
Central American Indians
0.0
/100
|
#317
Tragic
96.2%
Immigrants | Azores
0.0
/100
|
#318
Tragic
96.1%
Belizeans
0.0
/100
|
#319
Tragic
96.1%
Bangladeshis
0.0
/100
|
#320
Tragic
96.1%
Japanese
0.0
/100
|
#321
Tragic
96.0%
Immigrants | Vietnam
0.0
/100
|
#322
Tragic
96.0%
Immigrants | Nicaragua
0.0
/100
|
#323
Tragic
96.0%
Immigrants | Belize
0.0
/100
|
#324
Tragic
96.0%
Dominicans
0.0
/100
|
#325
Tragic
96.0%
Hispanics or Latinos
0.0
/100
|
#326
Tragic
96.0%
Hondurans
0.0
/100
|
#327
Tragic
96.0%
Mexican American Indians
0.0
/100
|
#328
Tragic
95.8%
Immigrants | Cambodia
0.0
/100
|
#329
Tragic
95.8%