Immigrants from Israel vs Immigrants from Burma/Myanmar Professional Degree

COMPARE

Immigrants from Israel
Race
Ancestry
AfghanAfricanAlaska NativeAlaskan AthabascanAlbanianAleutAlsatianAmericanApacheArabArapahoArgentineanArmenianAssyrian/Chaldean/SyriacAustralianAustrianBahamianBangladeshiBarbadianBasqueBelgianBelizeanBermudanBhutaneseBlackfeetBolivianBrazilianBritishBritish West IndianBulgarianBurmeseCajunCambodianCanadianCape VerdeanCarpatho RusynCelticCentral AmericanCentral American IndianCherokeeCheyenneChickasawChileanChineseChippewaChoctawColombianColvilleComancheCosta RicanCreeCreekCroatianCrowCubanCypriotCzechCzechoslovakianDanishDelawareDominicanDutchDutch West IndianEastern EuropeanEcuadorianEgyptianEnglishEstonianEthiopianEuropeanFijianFilipinoFinnishFrenchFrench American IndianFrench CanadianGermanGerman RussianGhanaianGreekGuamanian/ChamorroGuatemalanGuyaneseHaitianHmongHonduranHopiHoumaHungarianIcelanderIndian (Asian)IndonesianInupiatIranianIraqiIrishIroquoisIsraeliItalianJamaicanJapaneseJordanianKenyanKiowaKoreanLaotianLatvianLebaneseLiberianLithuanianLumbeeLuxembourgerMacedonianMalaysianMalteseMarshalleseMenomineeMexicanMexican American IndianMongolianMoroccanNative HawaiianNavajoNepaleseNew ZealanderNicaraguanNigerianNorthern EuropeanNorwegianOkinawanOsageOttawaPaiutePakistaniPalestinianPanamanianParaguayanPennsylvania GermanPeruvianPimaPolishPortuguesePotawatomiPuebloPuerto RicanPuget Sound SalishRomanianRussianSalvadoranSamoanScandinavianScotch-IrishScottishSeminoleSenegaleseSerbianShoshoneSierra LeoneanSiouxSlavicSlovakSloveneSomaliSouth AfricanSouth AmericanSouth American IndianSoviet UnionSpaniardSpanishSpanish AmericanSpanish American IndianSri LankanSubsaharan AfricanSudaneseSwedishSwissSyrianTaiwaneseThaiTlingit-HaidaTohono O'OdhamTonganTrinidadian and TobagonianTsimshianTurkishU.S. Virgin IslanderUgandanUkrainianUruguayanUteVenezuelanVietnameseWelshWest IndianYakamaYaquiYugoslavianYumanYup'ikZimbabwean
Immigration
NonimmigrantsImmigrantsAfghanistanAfricaAlbaniaArgentinaArmeniaAsiaAustraliaAustriaBahamasBangladeshBarbadosBelarusBelgiumBelizeBoliviaBosnia and HerzegovinaBrazilBulgariaCabo VerdeCambodiaCameroonCanadaCaribbeanCentral AmericaChileChinaColombiaCongoCosta RicaCroatiaCubaCzechoslovakiaDenmarkDominicaDominican RepublicEastern AfricaEastern AsiaEastern EuropeEcuadorEgyptEl SalvadorEnglandEritreaEthiopiaEuropeFijiFranceGermanyGhanaGreeceGrenadaGuatemalaGuyanaHaitiHondurasHong KongHungaryIndiaIndonesiaIranIraqIrelandIsraelItalyJamaicaJapanJordanKazakhstanKenyaKoreaKuwaitLaosLatin AmericaLatviaLebanonLiberiaLithuaniaMalaysiaMexicoMicronesiaMiddle AfricaMoldovaMoroccoNepalNetherlandsNicaraguaNigeriaNorth AmericaNorth MacedoniaNorthern AfricaNorthern EuropeNorwayOceaniaPakistanPanamaPeruPhilippinesPolandPortugalRomaniaRussiaSaudi ArabiaScotlandSenegalSerbiaSierra LeoneSingaporeSomaliaSouth AfricaSouth AmericaSouth Central AsiaSouth Eastern AsiaSouthern EuropeSpainSri LankaSt. Vincent and the GrenadinesSudanSwedenSwitzerlandSyriaTaiwanThailandTrinidad and TobagoTurkeyUgandaUkraineUruguayUzbekistanVenezuelaVietnamWest IndiesWestern AfricaWestern AsiaWestern EuropeYemenZaireZimbabweAzores
Immigrants from Burma/Myanmar
Race
Ancestry
AfghanAfricanAlaska NativeAlaskan AthabascanAlbanianAleutAlsatianAmericanApacheArabArapahoArgentineanArmenianAssyrian/Chaldean/SyriacAustralianAustrianBahamianBangladeshiBarbadianBasqueBelgianBelizeanBermudanBhutaneseBlackfeetBolivianBrazilianBritishBritish West IndianBulgarianBurmeseCajunCambodianCanadianCape VerdeanCarpatho RusynCelticCentral AmericanCentral American IndianCherokeeCheyenneChickasawChileanChineseChippewaChoctawColombianColvilleComancheCosta RicanCreeCreekCroatianCrowCubanCypriotCzechCzechoslovakianDanishDelawareDominicanDutchDutch West IndianEastern EuropeanEcuadorianEgyptianEnglishEstonianEthiopianEuropeanFijianFilipinoFinnishFrenchFrench American IndianFrench CanadianGermanGerman RussianGhanaianGreekGuamanian/ChamorroGuatemalanGuyaneseHaitianHmongHonduranHopiHoumaHungarianIcelanderIndian (Asian)IndonesianInupiatIranianIraqiIrishIroquoisIsraeliItalianJamaicanJapaneseJordanianKenyanKiowaKoreanLaotianLatvianLebaneseLiberianLithuanianLumbeeLuxembourgerMacedonianMalaysianMalteseMarshalleseMenomineeMexicanMexican American IndianMongolianMoroccanNative HawaiianNavajoNepaleseNew ZealanderNicaraguanNigerianNorthern EuropeanNorwegianOkinawanOsageOttawaPaiutePakistaniPalestinianPanamanianParaguayanPennsylvania GermanPeruvianPimaPolishPortuguesePotawatomiPuebloPuerto RicanPuget Sound SalishRomanianRussianSalvadoranSamoanScandinavianScotch-IrishScottishSeminoleSenegaleseSerbianShoshoneSierra LeoneanSiouxSlavicSlovakSloveneSomaliSouth AfricanSouth AmericanSouth American IndianSoviet UnionSpaniardSpanishSpanish AmericanSpanish American IndianSri LankanSubsaharan AfricanSudaneseSwedishSwissSyrianTaiwaneseThaiTlingit-HaidaTohono O'OdhamTonganTrinidadian and TobagonianTsimshianTurkishU.S. Virgin IslanderUgandanUkrainianUruguayanUteVenezuelanVietnameseWelshWest IndianYakamaYaquiYugoslavianYumanYup'ikZimbabwean
Immigration
NonimmigrantsImmigrantsAfghanistanAfricaAlbaniaArgentinaArmeniaAsiaAustraliaAustriaBahamasBangladeshBarbadosBelarusBelgiumBelizeBoliviaBosnia and HerzegovinaBrazilBulgariaBurma/MyanmarCabo VerdeCambodiaCameroonCanadaCaribbeanCentral AmericaChileChinaColombiaCongoCosta RicaCroatiaCubaCzechoslovakiaDenmarkDominicaDominican RepublicEastern AfricaEastern AsiaEastern EuropeEcuadorEgyptEl SalvadorEnglandEritreaEthiopiaEuropeFijiFranceGermanyGhanaGreeceGrenadaGuatemalaGuyanaHaitiHondurasHong KongHungaryIndiaIndonesiaIranIraqIrelandItalyJamaicaJapanJordanKazakhstanKenyaKoreaKuwaitLaosLatin AmericaLatviaLebanonLiberiaLithuaniaMalaysiaMexicoMicronesiaMiddle AfricaMoldovaMoroccoNepalNetherlandsNicaraguaNigeriaNorth AmericaNorth MacedoniaNorthern AfricaNorthern EuropeNorwayOceaniaPakistanPanamaPeruPhilippinesPolandPortugalRomaniaRussiaSaudi ArabiaScotlandSenegalSerbiaSierra LeoneSingaporeSomaliaSouth AfricaSouth AmericaSouth Central AsiaSouth Eastern AsiaSouthern EuropeSpainSri LankaSt. Vincent and the GrenadinesSudanSwedenSwitzerlandSyriaTaiwanThailandTrinidad and TobagoTurkeyUgandaUkraineUruguayUzbekistanVenezuelaVietnamWest IndiesWestern AfricaWestern AsiaWestern EuropeYemenZaireZimbabweAzores
Professional Degree
Income
Poverty
Unemployment
Labor Participation
Family Structure
Vehicle Availability
Education Level
Disability

Professional Degree Comparison

Immigrants from Israel

Immigrants from Burma/Myanmar

Exceptional
Tragic
7.9%
PROFESSIONAL DEGREE
100.0/ 100
METRIC RATING
1st/ 347
METRIC RANK
3.9%
PROFESSIONAL DEGREE
5.4/ 100
METRIC RATING
229th/ 347
METRIC RANK

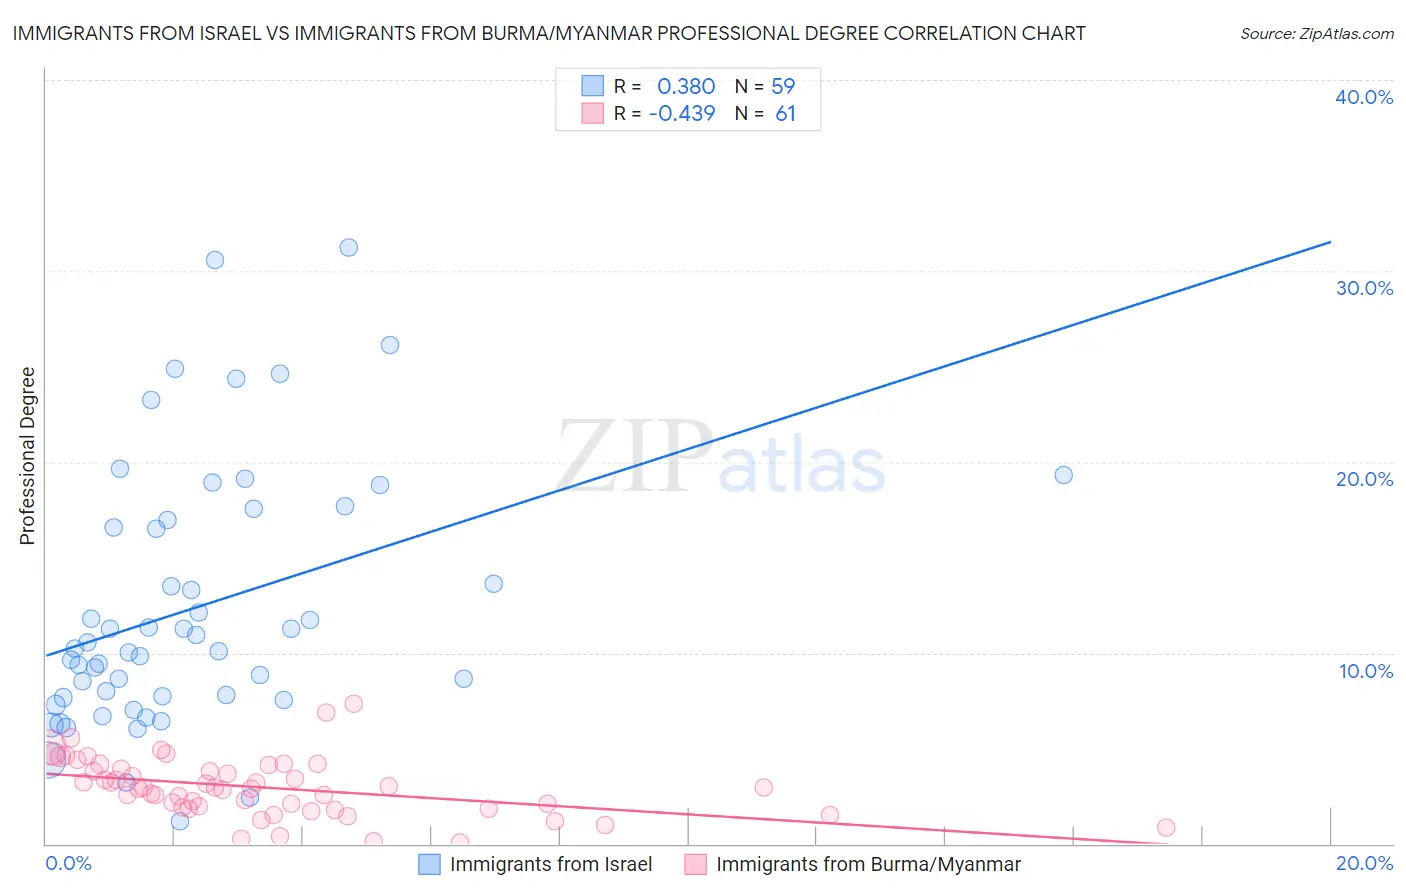
Immigrants from Israel vs Immigrants from Burma/Myanmar Professional Degree Correlation Chart

The statistical analysis conducted on geographies consisting of 209,922,622 people shows a mild positive correlation between the proportion of Immigrants from Israel and percentage of population with at least professional degree education in the United States with a correlation coefficient (R) of 0.380 and weighted average of 7.9%. Similarly, the statistical analysis conducted on geographies consisting of 172,191,729 people shows a moderate negative correlation between the proportion of Immigrants from Burma/Myanmar and percentage of population with at least professional degree education in the United States with a correlation coefficient (R) of -0.439 and weighted average of 3.9%, a difference of 98.9%.
Immigrants from Israel vs Immigrants from Burma/Myanmar Professional Degree

Professional Degree Correlation Summary

MeasurementImmigrants from IsraelImmigrants from Burma/Myanmar
Minimum1.2%0.034%
Maximum31.2%7.3%
Range30.0%7.3%
Mean12.4%3.0%
Median10.2%2.9%
Interquartile 25% (IQ1)7.6%1.9%
Interquartile 75% (IQ3)17.0%4.0%
Interquartile Range (IQR)9.3%2.1%
Standard Deviation (Sample)6.8%1.5%
Standard Deviation (Population)6.8%1.5%

Similar Demographics by Professional Degree

Demographics Similar to Immigrants from Israel by Professional Degree

In terms of professional degree, the demographic groups most similar to Immigrants from Israel are Immigrants from Singapore (7.7%, a difference of 1.4%), Iranian (7.6%, a difference of 3.1%), Filipino (7.6%, a difference of 3.9%), Immigrants from Iran (7.3%, a difference of 7.2%), and Okinawan (7.3%, a difference of 7.3%).
DemographicsRating | RankProfessional Degree
Immigrants | Israel
100.0
/100
|
#1
Exceptional
7.9%
Immigrants | Singapore
100.0
/100
|
#2
Exceptional
7.7%
Iranians
100.0
/100
|
#3
Exceptional
7.6%
Filipinos
100.0
/100
|
#4
Exceptional
7.6%
Immigrants | Iran
100.0
/100
|
#5
Exceptional
7.3%
Okinawans
100.0
/100
|
#6
Exceptional
7.3%
Eastern Europeans
100.0
/100
|
#7
Exceptional
7.1%
Immigrants | Switzerland
100.0
/100
|
#8
Exceptional
7.1%
Immigrants | Taiwan
100.0
/100
|
#9
Exceptional
7.1%
Immigrants | Belgium
100.0
/100
|
#10
Exceptional
7.0%
Cypriots
100.0
/100
|
#11
Exceptional
6.9%
Israelis
100.0
/100
|
#12
Exceptional
6.9%
Immigrants | Australia
100.0
/100
|
#13
Exceptional
6.9%
Immigrants | France
100.0
/100
|
#14
Exceptional
6.8%
Immigrants | China
100.0
/100
|
#15
Exceptional
6.7%

Demographics Similar to Immigrants from Burma/Myanmar by Professional Degree

In terms of professional degree, the demographic groups most similar to Immigrants from Burma/Myanmar are Immigrants from West Indies (4.0%, a difference of 0.14%), Nicaraguan (3.9%, a difference of 0.27%), Cuban (4.0%, a difference of 0.39%), German Russian (4.0%, a difference of 0.52%), and Ecuadorian (3.9%, a difference of 0.73%).
DemographicsRating | RankProfessional Degree
Immigrants | Western Africa
7.5
/100
|
#222
Tragic
4.0%
Immigrants | Bosnia and Herzegovina
7.4
/100
|
#223
Tragic
4.0%
Trinidadians and Tobagonians
7.1
/100
|
#224
Tragic
4.0%
Tlingit-Haida
6.9
/100
|
#225
Tragic
4.0%
German Russians
6.1
/100
|
#226
Tragic
4.0%
Cubans
5.9
/100
|
#227
Tragic
4.0%
Immigrants | West Indies
5.6
/100
|
#228
Tragic
4.0%
Immigrants | Burma/Myanmar
5.4
/100
|
#229
Tragic
3.9%
Nicaraguans
5.1
/100
|
#230
Tragic
3.9%
Ecuadorians
4.6
/100
|
#231
Tragic
3.9%
Cree
4.3
/100
|
#232
Tragic
3.9%
Immigrants | Philippines
4.1
/100
|
#233
Tragic
3.9%
Immigrants | Nonimmigrants
4.0
/100
|
#234
Tragic
3.9%
Immigrants | Barbados
4.0
/100
|
#235
Tragic
3.9%
Spanish Americans
3.8
/100
|
#236
Tragic
3.9%