Immigrants from Ireland vs Subsaharan African Bachelor's Degree
COMPARE
Immigrants from Ireland
Subsaharan African
Bachelor's Degree
Bachelor's Degree Comparison
Immigrants from Ireland
Sub-Saharan Africans
47.1%
BACHELOR'S DEGREE
100.0/ 100
METRIC RATING
21st/ 347
METRIC RANK
35.8%
BACHELOR'S DEGREE
9.8/ 100
METRIC RATING
218th/ 347
METRIC RANK
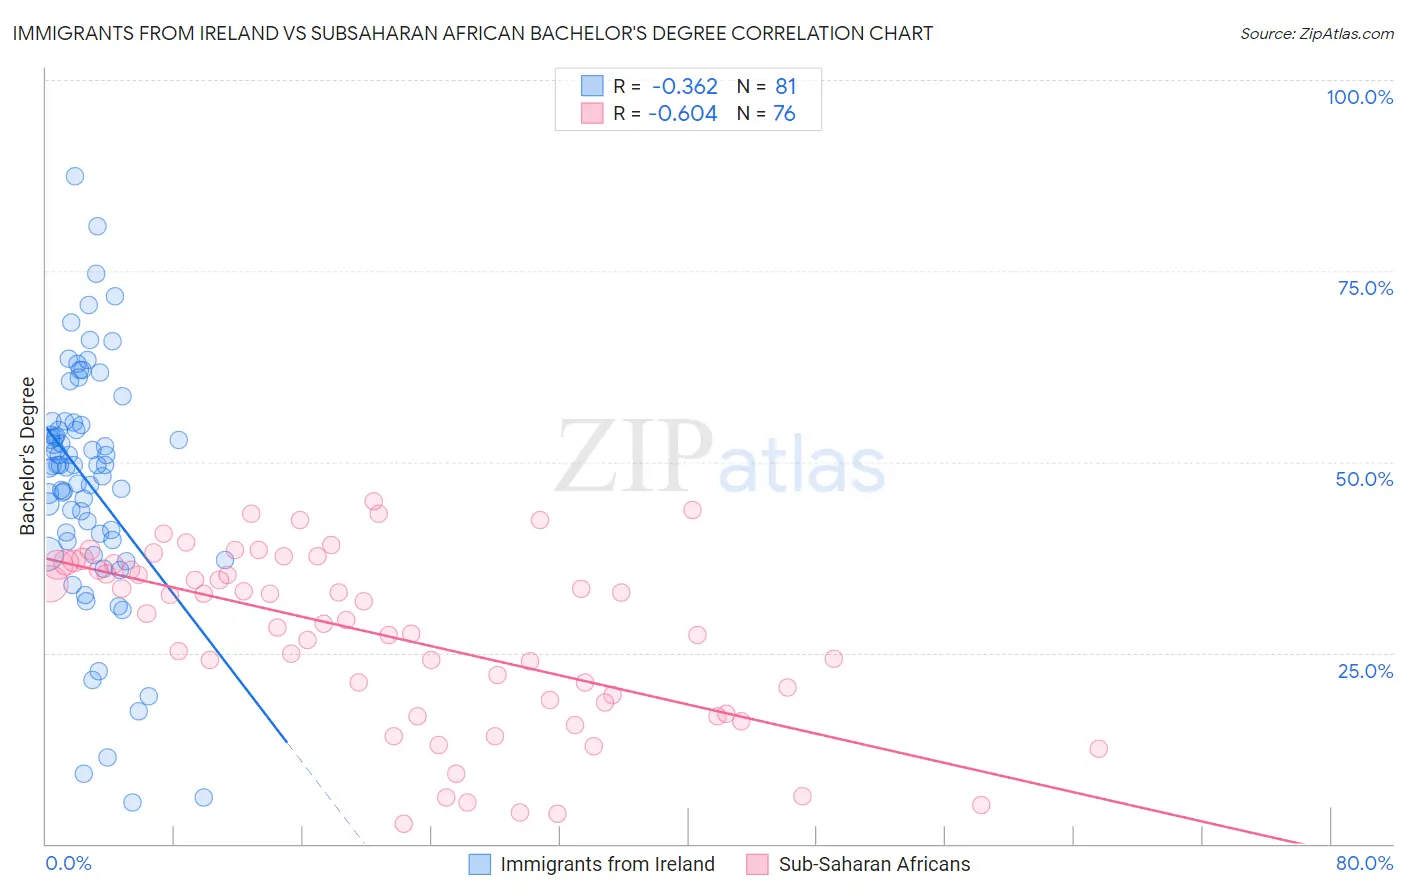
Immigrants from Ireland vs Subsaharan African Bachelor's Degree Correlation Chart
The statistical analysis conducted on geographies consisting of 240,784,048 people shows a mild negative correlation between the proportion of Immigrants from Ireland and percentage of population with at least bachelor's degree education in the United States with a correlation coefficient (R) of -0.362 and weighted average of 47.1%. Similarly, the statistical analysis conducted on geographies consisting of 508,116,051 people shows a significant negative correlation between the proportion of Sub-Saharan Africans and percentage of population with at least bachelor's degree education in the United States with a correlation coefficient (R) of -0.604 and weighted average of 35.8%, a difference of 31.7%.
Bachelor's Degree Correlation Summary
| Measurement | Immigrants from Ireland | Subsaharan African |
| Minimum | 5.4% | 2.6% |
| Maximum | 87.3% | 44.9% |
| Range | 82.0% | 42.3% |
| Mean | 47.3% | 27.3% |
| Median | 49.6% | 29.7% |
| Interquartile 25% (IQ1) | 39.7% | 18.7% |
| Interquartile 75% (IQ3) | 54.9% | 36.6% |
| Interquartile Range (IQR) | 15.2% | 17.9% |
| Standard Deviation (Sample) | 15.7% | 11.5% |
| Standard Deviation (Population) | 15.6% | 11.4% |
Similar Demographics by Bachelor's Degree
Demographics Similar to Immigrants from Ireland by Bachelor's Degree
In terms of bachelor's degree, the demographic groups most similar to Immigrants from Ireland are Immigrants from Switzerland (47.1%, a difference of 0.010%), Immigrants from Belgium (47.0%, a difference of 0.20%), Cambodian (47.2%, a difference of 0.23%), Immigrants from Sweden (47.0%, a difference of 0.29%), and Immigrants from Korea (47.0%, a difference of 0.33%).
| Demographics | Rating | Rank | Bachelor's Degree |
| Immigrants | Hong Kong | 100.0 /100 | #14 | Exceptional 48.2% |
| Immigrants | Eastern Asia | 100.0 /100 | #15 | Exceptional 48.1% |
| Soviet Union | 100.0 /100 | #16 | Exceptional 47.9% |
| Eastern Europeans | 100.0 /100 | #17 | Exceptional 47.5% |
| Indians (Asian) | 100.0 /100 | #18 | Exceptional 47.4% |
| Cambodians | 100.0 /100 | #19 | Exceptional 47.2% |
| Immigrants | Switzerland | 100.0 /100 | #20 | Exceptional 47.1% |
| Immigrants | Ireland | 100.0 /100 | #21 | Exceptional 47.1% |
| Immigrants | Belgium | 100.0 /100 | #22 | Exceptional 47.0% |
| Immigrants | Sweden | 100.0 /100 | #23 | Exceptional 47.0% |
| Immigrants | Korea | 100.0 /100 | #24 | Exceptional 47.0% |
| Burmese | 100.0 /100 | #25 | Exceptional 46.9% |
| Immigrants | Japan | 100.0 /100 | #26 | Exceptional 46.8% |
| Immigrants | France | 100.0 /100 | #27 | Exceptional 46.4% |
| Turks | 100.0 /100 | #28 | Exceptional 46.2% |
Demographics Similar to Sub-Saharan Africans by Bachelor's Degree
In terms of bachelor's degree, the demographic groups most similar to Sub-Saharan Africans are West Indian (35.8%, a difference of 0.030%), Spanish (35.8%, a difference of 0.070%), German Russian (35.8%, a difference of 0.10%), Dutch (35.7%, a difference of 0.18%), and Trinidadian and Tobagonian (35.7%, a difference of 0.32%).
| Demographics | Rating | Rank | Bachelor's Degree |
| Scotch-Irish | 18.3 /100 | #211 | Poor 36.4% |
| Immigrants | Philippines | 17.8 /100 | #212 | Poor 36.4% |
| Immigrants | Panama | 14.2 /100 | #213 | Poor 36.2% |
| Germans | 13.9 /100 | #214 | Poor 36.1% |
| Immigrants | Western Africa | 13.8 /100 | #215 | Poor 36.1% |
| Barbadians | 13.5 /100 | #216 | Poor 36.1% |
| German Russians | 10.2 /100 | #217 | Poor 35.8% |
| Sub-Saharan Africans | 9.8 /100 | #218 | Tragic 35.8% |
| West Indians | 9.7 /100 | #219 | Tragic 35.8% |
| Spanish | 9.6 /100 | #220 | Tragic 35.8% |
| Dutch | 9.2 /100 | #221 | Tragic 35.7% |
| Trinidadians and Tobagonians | 8.8 /100 | #222 | Tragic 35.7% |
| French Canadians | 8.3 /100 | #223 | Tragic 35.6% |
| Immigrants | Barbados | 7.5 /100 | #224 | Tragic 35.5% |
| Immigrants | Burma/Myanmar | 7.3 /100 | #225 | Tragic 35.5% |