Immigrants from Indonesia vs Colombian College, 1 year or more

COMPARE

Immigrants from Indonesia
Race
Ancestry
AfghanAfricanAlaska NativeAlaskan AthabascanAlbanianAleutAlsatianAmericanApacheArabArapahoArgentineanArmenianAssyrian/Chaldean/SyriacAustralianAustrianBahamianBangladeshiBarbadianBasqueBelgianBelizeanBermudanBhutaneseBlackfeetBolivianBrazilianBritishBritish West IndianBulgarianBurmeseCajunCambodianCanadianCape VerdeanCarpatho RusynCelticCentral AmericanCentral American IndianCherokeeCheyenneChickasawChileanChineseChippewaChoctawColvilleComancheCosta RicanCreeCreekCroatianCrowCubanCypriotCzechCzechoslovakianDanishDelawareDominicanDutchDutch West IndianEastern EuropeanEcuadorianEgyptianEnglishEstonianEthiopianEuropeanFijianFilipinoFinnishFrenchFrench American IndianFrench CanadianGermanGerman RussianGhanaianGreekGuamanian/ChamorroGuatemalanGuyaneseHaitianHmongHonduranHopiHoumaHungarianIcelanderIndian (Asian)IndonesianInupiatIranianIraqiIrishIroquoisIsraeliItalianJamaicanJapaneseJordanianKenyanKiowaKoreanLaotianLatvianLebaneseLiberianLithuanianLumbeeLuxembourgerMacedonianMalaysianMalteseMarshalleseMenomineeMexicanMexican American IndianMongolianMoroccanNative HawaiianNavajoNepaleseNew ZealanderNicaraguanNigerianNorthern EuropeanNorwegianOkinawanOsageOttawaPaiutePakistaniPalestinianPanamanianParaguayanPennsylvania GermanPeruvianPimaPolishPortuguesePotawatomiPuebloPuerto RicanPuget Sound SalishRomanianRussianSalvadoranSamoanScandinavianScotch-IrishScottishSeminoleSenegaleseSerbianShoshoneSierra LeoneanSiouxSlavicSlovakSloveneSomaliSouth AfricanSouth AmericanSouth American IndianSoviet UnionSpaniardSpanishSpanish AmericanSpanish American IndianSri LankanSubsaharan AfricanSudaneseSwedishSwissSyrianTaiwaneseThaiTlingit-HaidaTohono O'OdhamTonganTrinidadian and TobagonianTsimshianTurkishU.S. Virgin IslanderUgandanUkrainianUruguayanUteVenezuelanVietnameseWelshWest IndianYakamaYaquiYugoslavianYumanYup'ikZimbabwean
Immigration
NonimmigrantsImmigrantsAfghanistanAfricaAlbaniaArgentinaArmeniaAsiaAustraliaAustriaBahamasBangladeshBarbadosBelarusBelgiumBelizeBoliviaBosnia and HerzegovinaBrazilBulgariaBurma/MyanmarCabo VerdeCambodiaCameroonCanadaCaribbeanCentral AmericaChileChinaColombiaCongoCosta RicaCroatiaCubaCzechoslovakiaDenmarkDominicaDominican RepublicEastern AfricaEastern AsiaEastern EuropeEcuadorEgyptEl SalvadorEnglandEritreaEthiopiaEuropeFijiFranceGermanyGhanaGreeceGrenadaGuatemalaGuyanaHaitiHondurasHong KongHungaryIndiaIndonesiaIranIraqIrelandIsraelItalyJamaicaJapanJordanKazakhstanKenyaKoreaKuwaitLaosLatin AmericaLatviaLebanonLiberiaLithuaniaMalaysiaMexicoMicronesiaMiddle AfricaMoldovaMoroccoNepalNetherlandsNicaraguaNigeriaNorth AmericaNorth MacedoniaNorthern AfricaNorthern EuropeNorwayOceaniaPakistanPanamaPeruPhilippinesPolandPortugalRomaniaRussiaSaudi ArabiaScotlandSenegalSerbiaSierra LeoneSingaporeSomaliaSouth AfricaSouth AmericaSouth Central AsiaSouth Eastern AsiaSouthern EuropeSpainSri LankaSt. Vincent and the GrenadinesSudanSwedenSwitzerlandSyriaTaiwanThailandTrinidad and TobagoTurkeyUgandaUkraineUruguayUzbekistanVenezuelaVietnamWest IndiesWestern AfricaWestern AsiaWestern EuropeYemenZaireZimbabweAzores
Colombian
Race
Ancestry
AfghanAfricanAlaska NativeAlaskan AthabascanAlbanianAleutAlsatianAmericanApacheArabArapahoArgentineanArmenianAssyrian/Chaldean/SyriacAustralianAustrianBahamianBangladeshiBarbadianBasqueBelgianBelizeanBermudanBhutaneseBlackfeetBolivianBrazilianBritishBritish West IndianBulgarianBurmeseCajunCambodianCanadianCape VerdeanCarpatho RusynCelticCentral AmericanCentral American IndianCherokeeCheyenneChickasawChileanChineseChippewaChoctawColombianColvilleComancheCosta RicanCreeCreekCroatianCrowCubanCypriotCzechCzechoslovakianDanishDelawareDominicanDutchDutch West IndianEastern EuropeanEcuadorianEgyptianEnglishEstonianEthiopianEuropeanFijianFilipinoFinnishFrenchFrench American IndianFrench CanadianGermanGerman RussianGhanaianGreekGuamanian/ChamorroGuatemalanGuyaneseHaitianHmongHonduranHopiHoumaHungarianIcelanderIndian (Asian)IndonesianInupiatIranianIraqiIrishIroquoisIsraeliItalianJamaicanJapaneseJordanianKenyanKiowaKoreanLaotianLatvianLebaneseLiberianLithuanianLumbeeLuxembourgerMacedonianMalaysianMalteseMarshalleseMenomineeMexicanMexican American IndianMongolianMoroccanNative HawaiianNavajoNepaleseNew ZealanderNicaraguanNigerianNorthern EuropeanNorwegianOkinawanOsageOttawaPaiutePakistaniPalestinianPanamanianParaguayanPennsylvania GermanPeruvianPimaPolishPortuguesePotawatomiPuebloPuerto RicanPuget Sound SalishRomanianRussianSalvadoranSamoanScandinavianScotch-IrishScottishSeminoleSenegaleseSerbianShoshoneSierra LeoneanSiouxSlavicSlovakSloveneSomaliSouth AfricanSouth AmericanSouth American IndianSoviet UnionSpaniardSpanishSpanish AmericanSpanish American IndianSri LankanSubsaharan AfricanSudaneseSwedishSwissSyrianTaiwaneseThaiTlingit-HaidaTohono O'OdhamTonganTrinidadian and TobagonianTsimshianTurkishU.S. Virgin IslanderUgandanUkrainianUruguayanUteVenezuelanVietnameseWelshWest IndianYakamaYaquiYugoslavianYumanYup'ikZimbabwean
Immigration
NonimmigrantsImmigrantsAfghanistanAfricaAlbaniaArgentinaArmeniaAsiaAustraliaAustriaBahamasBangladeshBarbadosBelarusBelgiumBelizeBoliviaBosnia and HerzegovinaBrazilBulgariaBurma/MyanmarCabo VerdeCambodiaCameroonCanadaCaribbeanCentral AmericaChileChinaColombiaCongoCosta RicaCroatiaCubaCzechoslovakiaDenmarkDominicaDominican RepublicEastern AfricaEastern AsiaEastern EuropeEcuadorEgyptEl SalvadorEnglandEritreaEthiopiaEuropeFijiFranceGermanyGhanaGreeceGrenadaGuatemalaGuyanaHaitiHondurasHong KongHungaryIndiaIranIraqIrelandIsraelItalyJamaicaJapanJordanKazakhstanKenyaKoreaKuwaitLaosLatin AmericaLatviaLebanonLiberiaLithuaniaMalaysiaMexicoMicronesiaMiddle AfricaMoldovaMoroccoNepalNetherlandsNicaraguaNigeriaNorth AmericaNorth MacedoniaNorthern AfricaNorthern EuropeNorwayOceaniaPakistanPanamaPeruPhilippinesPolandPortugalRomaniaRussiaSaudi ArabiaScotlandSenegalSerbiaSierra LeoneSingaporeSomaliaSouth AfricaSouth AmericaSouth Central AsiaSouth Eastern AsiaSouthern EuropeSpainSri LankaSt. Vincent and the GrenadinesSudanSwedenSwitzerlandSyriaTaiwanThailandTrinidad and TobagoTurkeyUgandaUkraineUruguayUzbekistanVenezuelaVietnamWest IndiesWestern AfricaWestern AsiaWestern EuropeYemenZaireZimbabweAzores
College, 1 year or more
Income
Poverty
Unemployment
Labor Participation
Family Structure
Vehicle Availability
Education Level
Disability

College, 1 year or more Comparison

Immigrants from Indonesia

Colombians

Exceptional
Fair
63.5%
COLLEGE, 1 YEAR OR MORE
99.5/ 100
METRIC RATING
62nd/ 347
METRIC RANK
58.7%
COLLEGE, 1 YEAR OR MORE
27.6/ 100
METRIC RATING
192nd/ 347
METRIC RANK

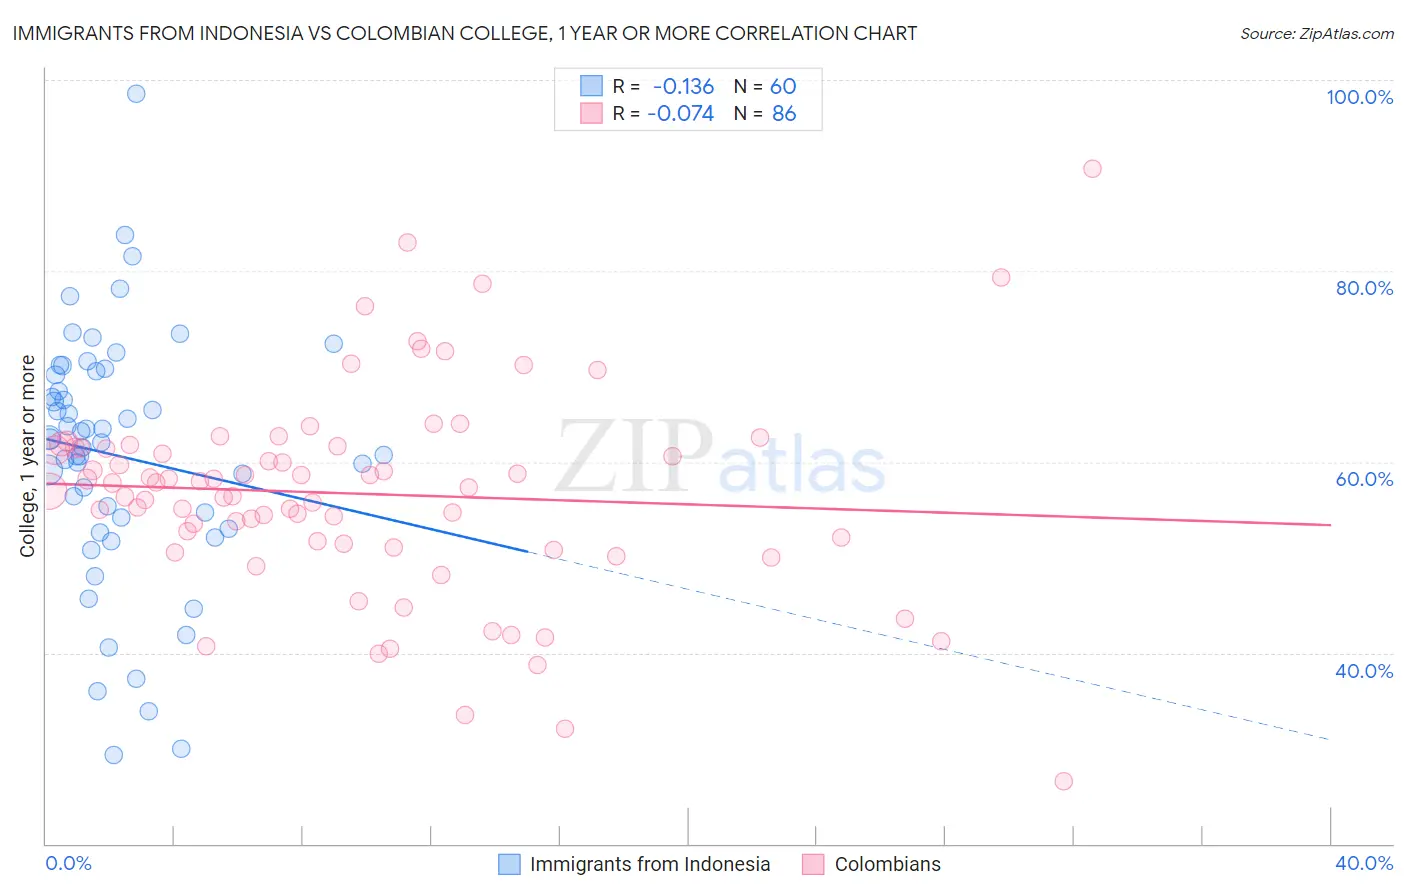
Immigrants from Indonesia vs Colombian College, 1 year or more Correlation Chart

The statistical analysis conducted on geographies consisting of 215,783,142 people shows a poor negative correlation between the proportion of Immigrants from Indonesia and percentage of population with at least college, 1 year or more education in the United States with a correlation coefficient (R) of -0.136 and weighted average of 63.5%. Similarly, the statistical analysis conducted on geographies consisting of 419,698,522 people shows a slight negative correlation between the proportion of Colombians and percentage of population with at least college, 1 year or more education in the United States with a correlation coefficient (R) of -0.074 and weighted average of 58.7%, a difference of 8.3%.
Immigrants from Indonesia vs Colombian College, 1 year or more

College, 1 year or more Correlation Summary

MeasurementImmigrants from IndonesiaColombian
Minimum29.3%26.5%
Maximum98.6%90.7%
Range69.3%64.2%
Mean60.6%56.7%
Median62.2%57.6%
Interquartile 25% (IQ1)53.6%51.5%
Interquartile 75% (IQ3)69.3%61.5%
Interquartile Range (IQR)15.7%10.0%
Standard Deviation (Sample)13.2%10.9%
Standard Deviation (Population)13.1%10.8%

Similar Demographics by College, 1 year or more

Demographics Similar to Immigrants from Indonesia by College, 1 year or more

In terms of college, 1 year or more, the demographic groups most similar to Immigrants from Indonesia are Bolivian (63.5%, a difference of 0.010%), Immigrants from Kazakhstan (63.6%, a difference of 0.12%), Immigrants from Scotland (63.4%, a difference of 0.13%), Immigrants from Spain (63.4%, a difference of 0.16%), and Maltese (63.4%, a difference of 0.27%).
DemographicsRating | RankCollege, 1 year or more
Immigrants | Belarus
99.7
/100
|
#55
Exceptional
64.1%
Immigrants | Czechoslovakia
99.7
/100
|
#56
Exceptional
64.1%
South Africans
99.7
/100
|
#57
Exceptional
64.1%
Immigrants | Asia
99.7
/100
|
#58
Exceptional
64.0%
Immigrants | Serbia
99.6
/100
|
#59
Exceptional
63.8%
Immigrants | Kazakhstan
99.5
/100
|
#60
Exceptional
63.6%
Bolivians
99.5
/100
|
#61
Exceptional
63.5%
Immigrants | Indonesia
99.5
/100
|
#62
Exceptional
63.5%
Immigrants | Scotland
99.4
/100
|
#63
Exceptional
63.4%
Immigrants | Spain
99.4
/100
|
#64
Exceptional
63.4%
Maltese
99.3
/100
|
#65
Exceptional
63.4%
Immigrants | Europe
99.3
/100
|
#66
Exceptional
63.3%
Immigrants | Romania
99.3
/100
|
#67
Exceptional
63.3%
Immigrants | Greece
99.3
/100
|
#68
Exceptional
63.3%
Immigrants | Zimbabwe
99.3
/100
|
#69
Exceptional
63.3%

Demographics Similar to Colombians by College, 1 year or more

In terms of college, 1 year or more, the demographic groups most similar to Colombians are Peruvian (58.6%, a difference of 0.010%), Costa Rican (58.6%, a difference of 0.080%), Immigrants from Philippines (58.7%, a difference of 0.10%), Dutch (58.6%, a difference of 0.10%), and Guamanian/Chamorro (58.6%, a difference of 0.10%).
DemographicsRating | RankCollege, 1 year or more
South Americans
35.9
/100
|
#185
Fair
59.0%
Scotch-Irish
34.7
/100
|
#186
Fair
58.9%
Germans
34.7
/100
|
#187
Fair
58.9%
French
34.4
/100
|
#188
Fair
58.9%
Uruguayans
31.8
/100
|
#189
Fair
58.8%
Immigrants | Cameroon
31.2
/100
|
#190
Fair
58.8%
Immigrants | Philippines
29.2
/100
|
#191
Fair
58.7%
Colombians
27.6
/100
|
#192
Fair
58.7%
Peruvians
27.5
/100
|
#193
Fair
58.6%
Costa Ricans
26.4
/100
|
#194
Fair
58.6%
Dutch
26.2
/100
|
#195
Fair
58.6%
Guamanians/Chamorros
26.2
/100
|
#196
Fair
58.6%
Immigrants | Thailand
26.0
/100
|
#197
Fair
58.6%
Immigrants | South Eastern Asia
25.1
/100
|
#198
Fair
58.5%
Slovaks
24.6
/100
|
#199
Fair
58.5%