Immigrants from Indonesia vs Chippewa 12th Grade, No Diploma

COMPARE

Immigrants from Indonesia
Race
Ancestry
AfghanAfricanAlaska NativeAlaskan AthabascanAlbanianAleutAlsatianAmericanApacheArabArapahoArgentineanArmenianAssyrian/Chaldean/SyriacAustralianAustrianBahamianBangladeshiBarbadianBasqueBelgianBelizeanBermudanBhutaneseBlackfeetBolivianBrazilianBritishBritish West IndianBulgarianBurmeseCajunCambodianCanadianCape VerdeanCarpatho RusynCelticCentral AmericanCentral American IndianCherokeeCheyenneChickasawChileanChineseChoctawColombianColvilleComancheCosta RicanCreeCreekCroatianCrowCubanCypriotCzechCzechoslovakianDanishDelawareDominicanDutchDutch West IndianEastern EuropeanEcuadorianEgyptianEnglishEstonianEthiopianEuropeanFijianFilipinoFinnishFrenchFrench American IndianFrench CanadianGermanGerman RussianGhanaianGreekGuamanian/ChamorroGuatemalanGuyaneseHaitianHmongHonduranHopiHoumaHungarianIcelanderIndian (Asian)IndonesianInupiatIranianIraqiIrishIroquoisIsraeliItalianJamaicanJapaneseJordanianKenyanKiowaKoreanLaotianLatvianLebaneseLiberianLithuanianLumbeeLuxembourgerMacedonianMalaysianMalteseMarshalleseMenomineeMexicanMexican American IndianMongolianMoroccanNative HawaiianNavajoNepaleseNew ZealanderNicaraguanNigerianNorthern EuropeanNorwegianOkinawanOsageOttawaPaiutePakistaniPalestinianPanamanianParaguayanPennsylvania GermanPeruvianPimaPolishPortuguesePotawatomiPuebloPuerto RicanPuget Sound SalishRomanianRussianSalvadoranSamoanScandinavianScotch-IrishScottishSeminoleSenegaleseSerbianShoshoneSierra LeoneanSiouxSlavicSlovakSloveneSomaliSouth AfricanSouth AmericanSouth American IndianSoviet UnionSpaniardSpanishSpanish AmericanSpanish American IndianSri LankanSubsaharan AfricanSudaneseSwedishSwissSyrianTaiwaneseThaiTlingit-HaidaTohono O'OdhamTonganTrinidadian and TobagonianTsimshianTurkishU.S. Virgin IslanderUgandanUkrainianUruguayanUteVenezuelanVietnameseWelshWest IndianYakamaYaquiYugoslavianYumanYup'ikZimbabwean
Immigration
NonimmigrantsImmigrantsAfghanistanAfricaAlbaniaArgentinaArmeniaAsiaAustraliaAustriaBahamasBangladeshBarbadosBelarusBelgiumBelizeBoliviaBosnia and HerzegovinaBrazilBulgariaBurma/MyanmarCabo VerdeCambodiaCameroonCanadaCaribbeanCentral AmericaChileChinaColombiaCongoCosta RicaCroatiaCubaCzechoslovakiaDenmarkDominicaDominican RepublicEastern AfricaEastern AsiaEastern EuropeEcuadorEgyptEl SalvadorEnglandEritreaEthiopiaEuropeFijiFranceGermanyGhanaGreeceGrenadaGuatemalaGuyanaHaitiHondurasHong KongHungaryIndiaIndonesiaIranIraqIrelandIsraelItalyJamaicaJapanJordanKazakhstanKenyaKoreaKuwaitLaosLatin AmericaLatviaLebanonLiberiaLithuaniaMalaysiaMexicoMicronesiaMiddle AfricaMoldovaMoroccoNepalNetherlandsNicaraguaNigeriaNorth AmericaNorth MacedoniaNorthern AfricaNorthern EuropeNorwayOceaniaPakistanPanamaPeruPhilippinesPolandPortugalRomaniaRussiaSaudi ArabiaScotlandSenegalSerbiaSierra LeoneSingaporeSomaliaSouth AfricaSouth AmericaSouth Central AsiaSouth Eastern AsiaSouthern EuropeSpainSri LankaSt. Vincent and the GrenadinesSudanSwedenSwitzerlandSyriaTaiwanThailandTrinidad and TobagoTurkeyUgandaUkraineUruguayUzbekistanVenezuelaVietnamWest IndiesWestern AfricaWestern AsiaWestern EuropeYemenZaireZimbabweAzores
Chippewa
Race
Ancestry
AfghanAfricanAlaska NativeAlaskan AthabascanAlbanianAleutAlsatianAmericanApacheArabArapahoArgentineanArmenianAssyrian/Chaldean/SyriacAustralianAustrianBahamianBangladeshiBarbadianBasqueBelgianBelizeanBermudanBhutaneseBlackfeetBolivianBrazilianBritishBritish West IndianBulgarianBurmeseCajunCambodianCanadianCape VerdeanCarpatho RusynCelticCentral AmericanCentral American IndianCherokeeCheyenneChickasawChileanChineseChippewaChoctawColombianColvilleComancheCosta RicanCreeCreekCroatianCrowCubanCypriotCzechCzechoslovakianDanishDelawareDominicanDutchDutch West IndianEastern EuropeanEcuadorianEgyptianEnglishEstonianEthiopianEuropeanFijianFilipinoFinnishFrenchFrench American IndianFrench CanadianGermanGerman RussianGhanaianGreekGuamanian/ChamorroGuatemalanGuyaneseHaitianHmongHonduranHopiHoumaHungarianIcelanderIndian (Asian)IndonesianInupiatIranianIraqiIrishIroquoisIsraeliItalianJamaicanJapaneseJordanianKenyanKiowaKoreanLaotianLatvianLebaneseLiberianLithuanianLumbeeLuxembourgerMacedonianMalaysianMalteseMarshalleseMenomineeMexicanMexican American IndianMongolianMoroccanNative HawaiianNavajoNepaleseNew ZealanderNicaraguanNigerianNorthern EuropeanNorwegianOkinawanOsageOttawaPaiutePakistaniPalestinianPanamanianParaguayanPennsylvania GermanPeruvianPimaPolishPortuguesePotawatomiPuebloPuerto RicanPuget Sound SalishRomanianRussianSalvadoranSamoanScandinavianScotch-IrishScottishSeminoleSenegaleseSerbianShoshoneSierra LeoneanSiouxSlavicSlovakSloveneSomaliSouth AfricanSouth AmericanSouth American IndianSoviet UnionSpaniardSpanishSpanish AmericanSpanish American IndianSri LankanSubsaharan AfricanSudaneseSwedishSwissSyrianTaiwaneseThaiTlingit-HaidaTohono O'OdhamTonganTrinidadian and TobagonianTsimshianTurkishU.S. Virgin IslanderUgandanUkrainianUruguayanUteVenezuelanVietnameseWelshWest IndianYakamaYaquiYugoslavianYumanYup'ikZimbabwean
Immigration
NonimmigrantsImmigrantsAfghanistanAfricaAlbaniaArgentinaArmeniaAsiaAustraliaAustriaBahamasBangladeshBarbadosBelarusBelgiumBelizeBoliviaBosnia and HerzegovinaBrazilBulgariaBurma/MyanmarCabo VerdeCambodiaCameroonCanadaCaribbeanCentral AmericaChileChinaColombiaCongoCosta RicaCroatiaCubaCzechoslovakiaDenmarkDominicaDominican RepublicEastern AfricaEastern AsiaEastern EuropeEcuadorEgyptEl SalvadorEnglandEritreaEthiopiaEuropeFijiFranceGermanyGhanaGreeceGrenadaGuatemalaGuyanaHaitiHondurasHong KongHungaryIndiaIranIraqIrelandIsraelItalyJamaicaJapanJordanKazakhstanKenyaKoreaKuwaitLaosLatin AmericaLatviaLebanonLiberiaLithuaniaMalaysiaMexicoMicronesiaMiddle AfricaMoldovaMoroccoNepalNetherlandsNicaraguaNigeriaNorth AmericaNorth MacedoniaNorthern AfricaNorthern EuropeNorwayOceaniaPakistanPanamaPeruPhilippinesPolandPortugalRomaniaRussiaSaudi ArabiaScotlandSenegalSerbiaSierra LeoneSingaporeSomaliaSouth AfricaSouth AmericaSouth Central AsiaSouth Eastern AsiaSouthern EuropeSpainSri LankaSt. Vincent and the GrenadinesSudanSwedenSwitzerlandSyriaTaiwanThailandTrinidad and TobagoTurkeyUgandaUkraineUruguayUzbekistanVenezuelaVietnamWest IndiesWestern AfricaWestern AsiaWestern EuropeYemenZaireZimbabweAzores
12th Grade, No Diploma
Income
Poverty
Unemployment
Labor Participation
Family Structure
Vehicle Availability
Education Level
Disability

12th Grade, No Diploma Comparison

Immigrants from Indonesia

Chippewa

Average
Good
91.2%
12TH GRADE, NO DIPLOMA
54.9/ 100
METRIC RATING
169th/ 347
METRIC RANK
91.5%
12TH GRADE, NO DIPLOMA
78.8/ 100
METRIC RATING
151st/ 347
METRIC RANK

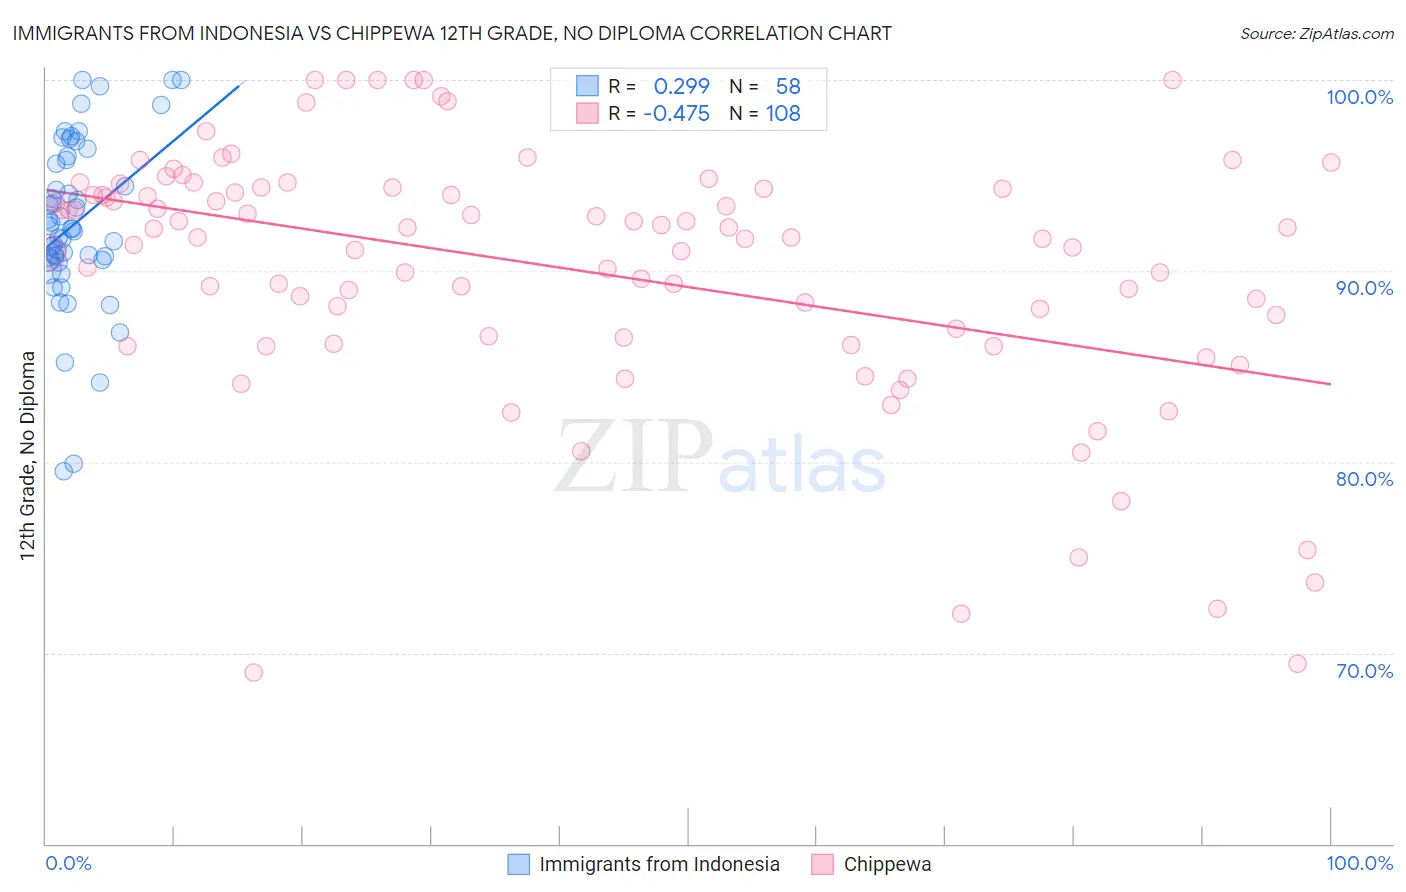
Immigrants from Indonesia vs Chippewa 12th Grade, No Diploma Correlation Chart

The statistical analysis conducted on geographies consisting of 215,765,946 people shows a weak positive correlation between the proportion of Immigrants from Indonesia and percentage of population with at least 12th grade (no diploma) education in the United States with a correlation coefficient (R) of 0.299 and weighted average of 91.2%. Similarly, the statistical analysis conducted on geographies consisting of 215,068,347 people shows a moderate negative correlation between the proportion of Chippewa and percentage of population with at least 12th grade (no diploma) education in the United States with a correlation coefficient (R) of -0.475 and weighted average of 91.5%, a difference of 0.34%.
Immigrants from Indonesia vs Chippewa 12th Grade, No Diploma

12th Grade, No Diploma Correlation Summary

MeasurementImmigrants from IndonesiaChippewa
Minimum79.5%69.0%
Maximum100.0%100.0%
Range20.5%31.0%
Mean92.5%90.1%
Median92.2%91.8%
Interquartile 25% (IQ1)90.6%86.5%
Interquartile 75% (IQ3)95.8%94.3%
Interquartile Range (IQR)5.3%7.8%
Standard Deviation (Sample)4.4%6.7%
Standard Deviation (Population)4.3%6.6%

Demographics Similar to Immigrants from Indonesia and Chippewa by 12th Grade, No Diploma

In terms of 12th grade, no diploma, the demographic groups most similar to Immigrants from Indonesia are Cree (91.2%, a difference of 0.030%), Delaware (91.2%, a difference of 0.030%), Alsatian (91.3%, a difference of 0.040%), Hmong (91.3%, a difference of 0.040%), and Immigrants from Malaysia (91.3%, a difference of 0.040%). Similarly, the demographic groups most similar to Chippewa are Paraguayan (91.5%, a difference of 0.0%), Kenyan (91.5%, a difference of 0.030%), Iraqi (91.5%, a difference of 0.060%), Immigrants from Kenya (91.5%, a difference of 0.080%), and Immigrants from Iraq (91.4%, a difference of 0.10%).
DemographicsRating | Rank12th Grade, No Diploma
Paraguayans
78.9
/100
|
#150
Good
91.5%
Chippewa
78.8
/100
|
#151
Good
91.5%
Kenyans
77.4
/100
|
#152
Good
91.5%
Iraqis
75.3
/100
|
#153
Good
91.5%
Immigrants | Kenya
73.9
/100
|
#154
Good
91.5%
Immigrants | Iraq
73.0
/100
|
#155
Good
91.4%
Asians
71.9
/100
|
#156
Good
91.4%
Immigrants | Pakistan
70.7
/100
|
#157
Good
91.4%
Immigrants | Northern Africa
66.2
/100
|
#158
Good
91.4%
Laotians
64.4
/100
|
#159
Good
91.3%
Immigrants | Albania
64.1
/100
|
#160
Good
91.3%
Immigrants | Hong Kong
63.8
/100
|
#161
Good
91.3%
Brazilians
62.0
/100
|
#162
Good
91.3%
Immigrants | Asia
61.5
/100
|
#163
Good
91.3%
Immigrants | China
60.9
/100
|
#164
Good
91.3%
Alsatians
58.3
/100
|
#165
Average
91.3%
Hmong
58.0
/100
|
#166
Average
91.3%
Immigrants | Malaysia
57.8
/100
|
#167
Average
91.3%
Cree
57.0
/100
|
#168
Average
91.2%
Immigrants | Indonesia
54.9
/100
|
#169
Average
91.2%
Delaware
52.8
/100
|
#170
Average
91.2%