Immigrants from India vs White/Caucasian 9th Grade

COMPARE

Immigrants from India
Race
Ancestry
AfghanAfricanAlaska NativeAlaskan AthabascanAlbanianAleutAlsatianAmericanApacheArabArapahoArgentineanArmenianAssyrian/Chaldean/SyriacAustralianAustrianBahamianBangladeshiBarbadianBasqueBelgianBelizeanBermudanBhutaneseBlackfeetBolivianBrazilianBritishBritish West IndianBulgarianBurmeseCajunCambodianCanadianCape VerdeanCarpatho RusynCelticCentral AmericanCentral American IndianCherokeeCheyenneChickasawChileanChineseChippewaChoctawColombianColvilleComancheCosta RicanCreeCreekCroatianCrowCubanCypriotCzechCzechoslovakianDanishDelawareDominicanDutchDutch West IndianEastern EuropeanEcuadorianEgyptianEnglishEstonianEthiopianEuropeanFijianFilipinoFinnishFrenchFrench American IndianFrench CanadianGermanGerman RussianGhanaianGreekGuamanian/ChamorroGuatemalanGuyaneseHaitianHmongHonduranHopiHoumaHungarianIcelanderIndian (Asian)IndonesianInupiatIranianIraqiIrishIroquoisIsraeliItalianJamaicanJapaneseJordanianKenyanKiowaKoreanLaotianLatvianLebaneseLiberianLithuanianLumbeeLuxembourgerMacedonianMalaysianMalteseMarshalleseMenomineeMexicanMexican American IndianMongolianMoroccanNative HawaiianNavajoNepaleseNew ZealanderNicaraguanNigerianNorthern EuropeanNorwegianOkinawanOsageOttawaPaiutePakistaniPalestinianPanamanianParaguayanPennsylvania GermanPeruvianPimaPolishPortuguesePotawatomiPuebloPuerto RicanPuget Sound SalishRomanianRussianSalvadoranSamoanScandinavianScotch-IrishScottishSeminoleSenegaleseSerbianShoshoneSierra LeoneanSiouxSlavicSlovakSloveneSomaliSouth AfricanSouth AmericanSouth American IndianSoviet UnionSpaniardSpanishSpanish AmericanSpanish American IndianSri LankanSubsaharan AfricanSudaneseSwedishSwissSyrianTaiwaneseThaiTlingit-HaidaTohono O'OdhamTonganTrinidadian and TobagonianTsimshianTurkishU.S. Virgin IslanderUgandanUkrainianUruguayanUteVenezuelanVietnameseWelshWest IndianYakamaYaquiYugoslavianYumanYup'ikZimbabwean
Immigration
NonimmigrantsImmigrantsAfghanistanAfricaAlbaniaArgentinaArmeniaAsiaAustraliaAustriaBahamasBangladeshBarbadosBelarusBelgiumBelizeBoliviaBosnia and HerzegovinaBrazilBulgariaBurma/MyanmarCabo VerdeCambodiaCameroonCanadaCaribbeanCentral AmericaChileChinaColombiaCongoCosta RicaCroatiaCubaCzechoslovakiaDenmarkDominicaDominican RepublicEastern AfricaEastern AsiaEastern EuropeEcuadorEgyptEl SalvadorEnglandEritreaEthiopiaEuropeFijiFranceGermanyGhanaGreeceGrenadaGuatemalaGuyanaHaitiHondurasHong KongHungaryIndiaIndonesiaIranIraqIrelandIsraelItalyJamaicaJapanJordanKazakhstanKenyaKoreaKuwaitLaosLatin AmericaLatviaLebanonLiberiaLithuaniaMalaysiaMexicoMicronesiaMiddle AfricaMoldovaMoroccoNepalNetherlandsNicaraguaNigeriaNorth AmericaNorth MacedoniaNorthern AfricaNorthern EuropeNorwayOceaniaPakistanPanamaPeruPhilippinesPolandPortugalRomaniaRussiaSaudi ArabiaScotlandSenegalSerbiaSierra LeoneSingaporeSomaliaSouth AfricaSouth AmericaSouth Central AsiaSouth Eastern AsiaSouthern EuropeSpainSri LankaSt. Vincent and the GrenadinesSudanSwedenSwitzerlandSyriaTaiwanThailandTrinidad and TobagoTurkeyUgandaUkraineUruguayUzbekistanVenezuelaVietnamWest IndiesWestern AfricaWestern AsiaWestern EuropeYemenZaireZimbabweAzores
White/Caucasian
Race
Ancestry
AfghanAfricanAlaska NativeAlaskan AthabascanAlbanianAleutAlsatianAmericanApacheArabArapahoArgentineanArmenianAssyrian/Chaldean/SyriacAustralianAustrianBahamianBangladeshiBarbadianBasqueBelgianBelizeanBermudanBhutaneseBlackfeetBolivianBrazilianBritishBritish West IndianBulgarianBurmeseCajunCambodianCanadianCape VerdeanCarpatho RusynCelticCentral AmericanCentral American IndianCherokeeCheyenneChickasawChileanChineseChippewaChoctawColombianColvilleComancheCosta RicanCreeCreekCroatianCrowCubanCypriotCzechCzechoslovakianDanishDelawareDominicanDutchDutch West IndianEastern EuropeanEcuadorianEgyptianEnglishEstonianEthiopianEuropeanFijianFilipinoFinnishFrenchFrench American IndianFrench CanadianGermanGerman RussianGhanaianGreekGuamanian/ChamorroGuatemalanGuyaneseHaitianHmongHonduranHopiHoumaHungarianIcelanderIndian (Asian)IndonesianInupiatIranianIraqiIrishIroquoisIsraeliItalianJamaicanJapaneseJordanianKenyanKiowaKoreanLaotianLatvianLebaneseLiberianLithuanianLumbeeLuxembourgerMacedonianMalaysianMalteseMarshalleseMenomineeMexicanMexican American IndianMongolianMoroccanNative HawaiianNavajoNepaleseNew ZealanderNicaraguanNigerianNorthern EuropeanNorwegianOkinawanOsageOttawaPaiutePakistaniPalestinianPanamanianParaguayanPennsylvania GermanPeruvianPimaPolishPortuguesePotawatomiPuebloPuerto RicanPuget Sound SalishRomanianRussianSalvadoranSamoanScandinavianScotch-IrishScottishSeminoleSenegaleseSerbianShoshoneSierra LeoneanSiouxSlavicSlovakSloveneSomaliSouth AfricanSouth AmericanSouth American IndianSoviet UnionSpaniardSpanishSpanish AmericanSpanish American IndianSri LankanSubsaharan AfricanSudaneseSwedishSwissSyrianTaiwaneseThaiTlingit-HaidaTohono O'OdhamTonganTrinidadian and TobagonianTsimshianTurkishU.S. Virgin IslanderUgandanUkrainianUruguayanUteVenezuelanVietnameseWelshWest IndianYakamaYaquiYugoslavianYumanYup'ikZimbabwean
Immigration
NonimmigrantsImmigrantsAfghanistanAfricaAlbaniaArgentinaArmeniaAsiaAustraliaAustriaBahamasBangladeshBarbadosBelarusBelgiumBelizeBoliviaBosnia and HerzegovinaBrazilBulgariaBurma/MyanmarCabo VerdeCambodiaCameroonCanadaCaribbeanCentral AmericaChileChinaColombiaCongoCosta RicaCroatiaCubaCzechoslovakiaDenmarkDominicaDominican RepublicEastern AfricaEastern AsiaEastern EuropeEcuadorEgyptEl SalvadorEnglandEritreaEthiopiaEuropeFijiFranceGermanyGhanaGreeceGrenadaGuatemalaGuyanaHaitiHondurasHong KongHungaryIndonesiaIranIraqIrelandIsraelItalyJamaicaJapanJordanKazakhstanKenyaKoreaKuwaitLaosLatin AmericaLatviaLebanonLiberiaLithuaniaMalaysiaMexicoMicronesiaMiddle AfricaMoldovaMoroccoNepalNetherlandsNicaraguaNigeriaNorth AmericaNorth MacedoniaNorthern AfricaNorthern EuropeNorwayOceaniaPakistanPanamaPeruPhilippinesPolandPortugalRomaniaRussiaSaudi ArabiaScotlandSenegalSerbiaSierra LeoneSingaporeSomaliaSouth AfricaSouth AmericaSouth Central AsiaSouth Eastern AsiaSouthern EuropeSpainSri LankaSt. Vincent and the GrenadinesSudanSwedenSwitzerlandSyriaTaiwanThailandTrinidad and TobagoTurkeyUgandaUkraineUruguayUzbekistanVenezuelaVietnamWest IndiesWestern AfricaWestern AsiaWestern EuropeYemenZaireZimbabweAzores
9th Grade
Income
Poverty
Unemployment
Labor Participation
Family Structure
Vehicle Availability
Education Level
Disability

9th Grade Comparison

Immigrants from India

Whites/Caucasians

Exceptional
Exceptional
96.1%
9TH GRADE
99.9/ 100
METRIC RATING
46th/ 347
METRIC RANK
95.8%
9TH GRADE
99.4/ 100
METRIC RATING
77th/ 347
METRIC RANK

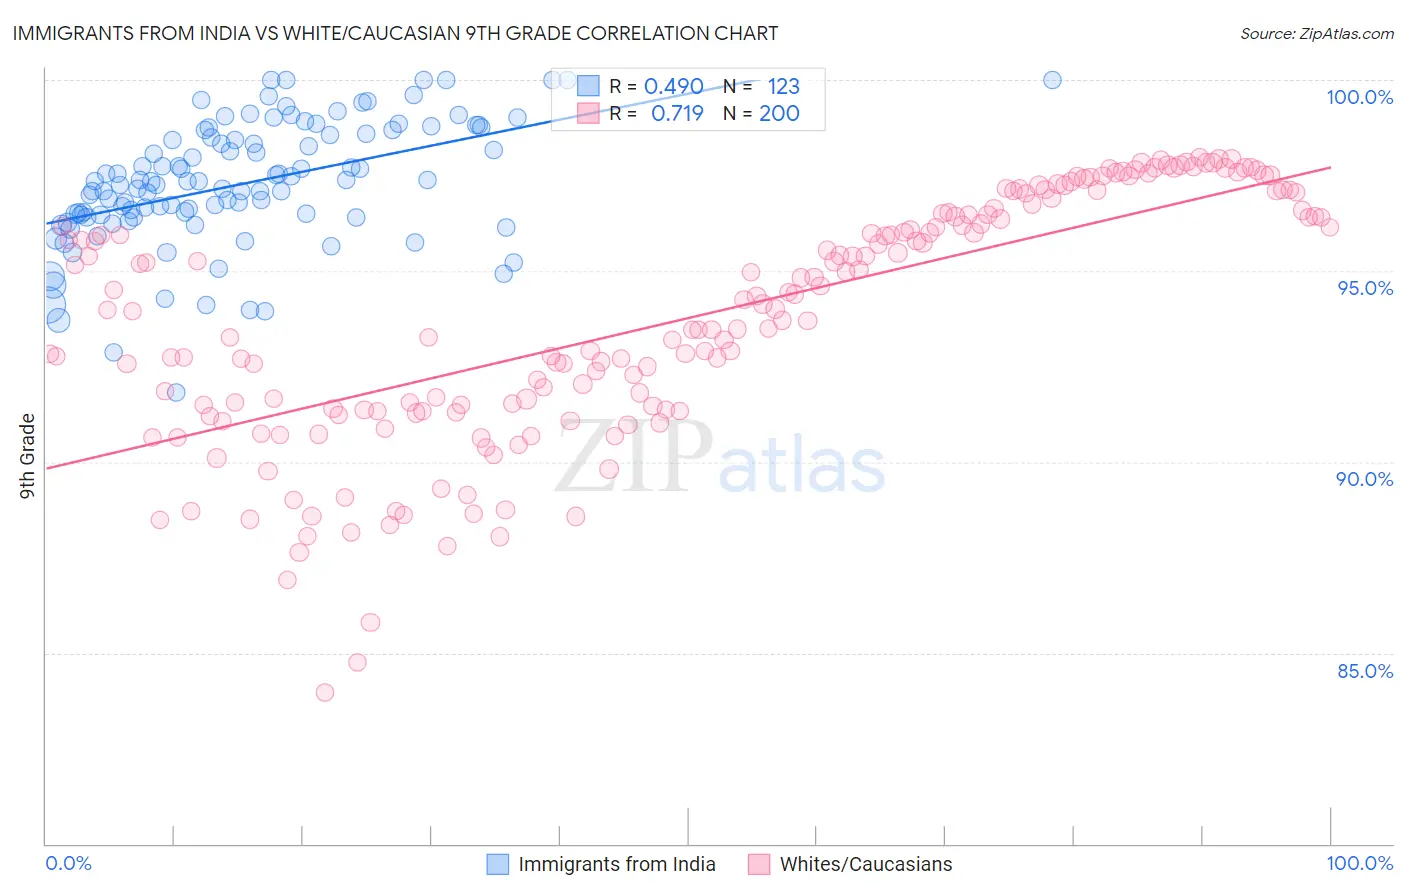
Immigrants from India vs White/Caucasian 9th Grade Correlation Chart

The statistical analysis conducted on geographies consisting of 434,105,844 people shows a moderate positive correlation between the proportion of Immigrants from India and percentage of population with at least 9th grade education in the United States with a correlation coefficient (R) of 0.490 and weighted average of 96.1%. Similarly, the statistical analysis conducted on geographies consisting of 585,245,517 people shows a strong positive correlation between the proportion of Whites/Caucasians and percentage of population with at least 9th grade education in the United States with a correlation coefficient (R) of 0.719 and weighted average of 95.8%, a difference of 0.30%.
Immigrants from India vs White/Caucasian 9th Grade

9th Grade Correlation Summary

MeasurementImmigrants from IndiaWhite/Caucasian
Minimum91.8%84.0%
Maximum100.0%98.0%
Range8.2%14.0%
Mean97.3%93.8%
Median97.3%94.1%
Interquartile 25% (IQ1)96.4%91.4%
Interquartile 75% (IQ3)98.6%96.5%
Interquartile Range (IQR)2.2%5.1%
Standard Deviation (Sample)1.6%3.2%
Standard Deviation (Population)1.6%3.2%

Similar Demographics by 9th Grade

Demographics Similar to Immigrants from India by 9th Grade

In terms of 9th grade, the demographic groups most similar to Immigrants from India are Crow (96.1%, a difference of 0.0%), Alaska Native (96.1%, a difference of 0.010%), Russian (96.0%, a difference of 0.010%), Australian (96.0%, a difference of 0.010%), and Greek (96.0%, a difference of 0.020%).
DemographicsRating | Rank9th Grade
Ottawa
99.9
/100
|
#39
Exceptional
96.1%
Slavs
99.9
/100
|
#40
Exceptional
96.1%
Czechoslovakians
99.9
/100
|
#41
Exceptional
96.1%
Chippewa
99.9
/100
|
#42
Exceptional
96.1%
Iranians
99.9
/100
|
#43
Exceptional
96.1%
Alaska Natives
99.9
/100
|
#44
Exceptional
96.1%
Crow
99.9
/100
|
#45
Exceptional
96.1%
Immigrants | India
99.9
/100
|
#46
Exceptional
96.1%
Russians
99.9
/100
|
#47
Exceptional
96.0%
Australians
99.9
/100
|
#48
Exceptional
96.0%
Greeks
99.9
/100
|
#49
Exceptional
96.0%
Celtics
99.9
/100
|
#50
Exceptional
96.0%
Immigrants | Northern Europe
99.9
/100
|
#51
Exceptional
96.0%
Serbians
99.9
/100
|
#52
Exceptional
96.0%
Austrians
99.8
/100
|
#53
Exceptional
96.0%

Demographics Similar to Whites/Caucasians by 9th Grade

In terms of 9th grade, the demographic groups most similar to Whites/Caucasians are Immigrants from South Africa (95.8%, a difference of 0.0%), Inupiat (95.8%, a difference of 0.010%), Immigrants from Sweden (95.8%, a difference of 0.010%), Thai (95.8%, a difference of 0.020%), and Immigrants from Belgium (95.8%, a difference of 0.030%).
DemographicsRating | Rank9th Grade
Immigrants | Australia
99.5
/100
|
#70
Exceptional
95.8%
Immigrants | Belgium
99.5
/100
|
#71
Exceptional
95.8%
Turks
99.5
/100
|
#72
Exceptional
95.8%
Immigrants | Singapore
99.5
/100
|
#73
Exceptional
95.8%
Thais
99.5
/100
|
#74
Exceptional
95.8%
Inupiat
99.5
/100
|
#75
Exceptional
95.8%
Immigrants | Sweden
99.5
/100
|
#76
Exceptional
95.8%
Whites/Caucasians
99.4
/100
|
#77
Exceptional
95.8%
Immigrants | South Africa
99.4
/100
|
#78
Exceptional
95.8%
Romanians
99.3
/100
|
#79
Exceptional
95.7%
Bhutanese
99.3
/100
|
#80
Exceptional
95.7%
Arapaho
99.3
/100
|
#81
Exceptional
95.7%
Puget Sound Salish
99.2
/100
|
#82
Exceptional
95.7%
Swiss
99.2
/100
|
#83
Exceptional
95.7%
Immigrants | Denmark
99.1
/100
|
#84
Exceptional
95.7%