Immigrants from India vs Norwegian Associate's Degree
COMPARE
Immigrants from India
Norwegian
Associate's Degree
Associate's Degree Comparison
Immigrants from India
Norwegians
58.5%
ASSOCIATE'S DEGREE
100.0/ 100
METRIC RATING
3rd/ 347
METRIC RANK
47.6%
ASSOCIATE'S DEGREE
81.0/ 100
METRIC RATING
143rd/ 347
METRIC RANK
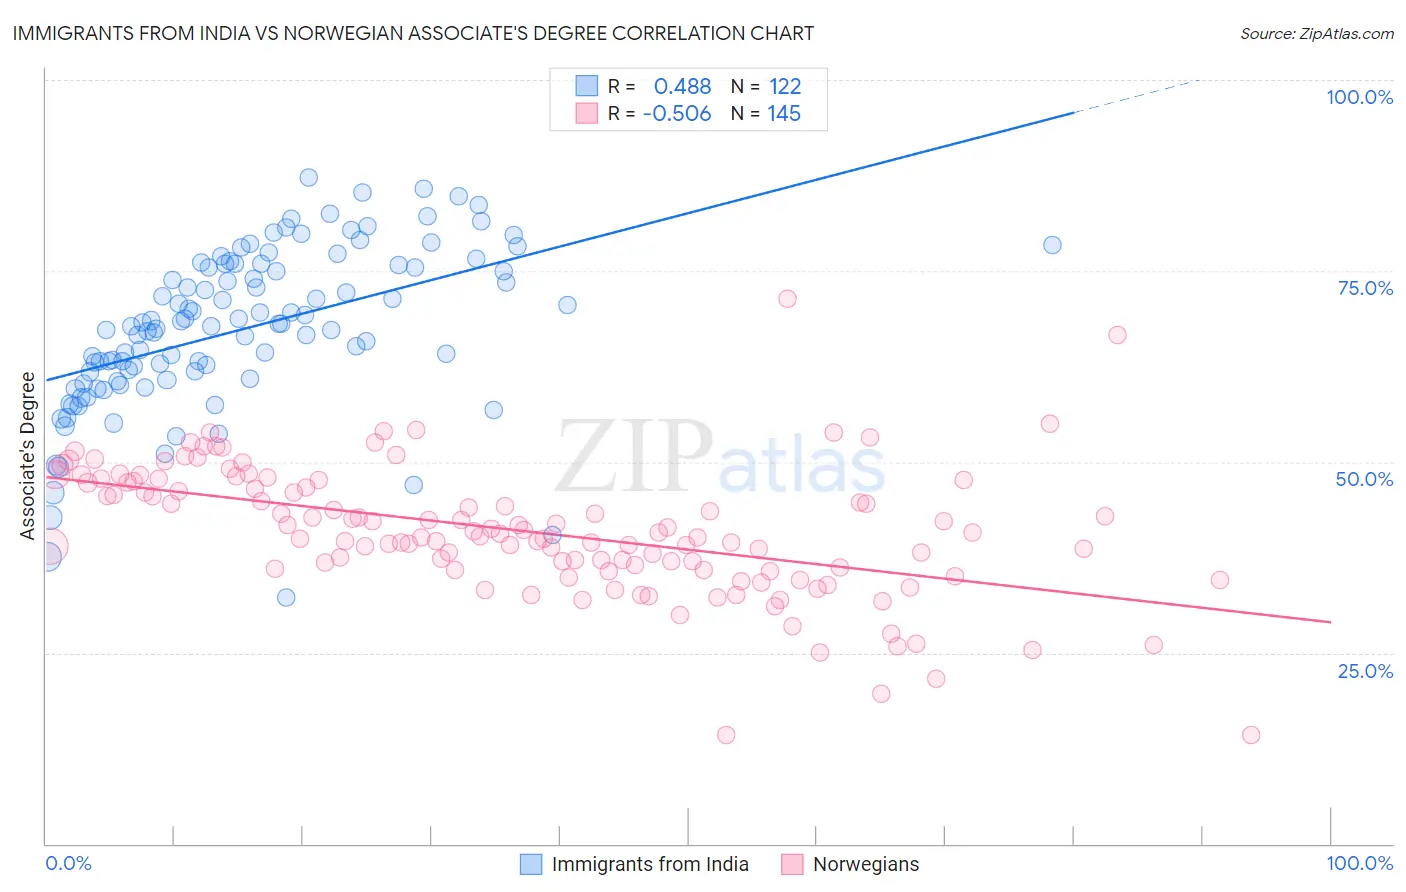
Immigrants from India vs Norwegian Associate's Degree Correlation Chart
The statistical analysis conducted on geographies consisting of 434,068,008 people shows a moderate positive correlation between the proportion of Immigrants from India and percentage of population with at least associate's degree education in the United States with a correlation coefficient (R) of 0.488 and weighted average of 58.5%. Similarly, the statistical analysis conducted on geographies consisting of 533,342,893 people shows a substantial negative correlation between the proportion of Norwegians and percentage of population with at least associate's degree education in the United States with a correlation coefficient (R) of -0.506 and weighted average of 47.6%, a difference of 23.0%.
Associate's Degree Correlation Summary
| Measurement | Immigrants from India | Norwegian |
| Minimum | 32.2% | 14.2% |
| Maximum | 87.3% | 71.4% |
| Range | 55.1% | 57.2% |
| Mean | 67.4% | 40.9% |
| Median | 67.9% | 40.6% |
| Interquartile 25% (IQ1) | 60.9% | 35.9% |
| Interquartile 75% (IQ3) | 75.8% | 47.3% |
| Interquartile Range (IQR) | 14.8% | 11.4% |
| Standard Deviation (Sample) | 10.5% | 8.6% |
| Standard Deviation (Population) | 10.5% | 8.6% |
Similar Demographics by Associate's Degree
Demographics Similar to Immigrants from India by Associate's Degree
In terms of associate's degree, the demographic groups most similar to Immigrants from India are Immigrants from Taiwan (58.4%, a difference of 0.25%), Immigrants from Singapore (58.9%, a difference of 0.66%), Iranian (58.2%, a difference of 0.66%), Okinawan (57.7%, a difference of 1.5%), and Immigrants from Iran (57.7%, a difference of 1.5%).
| Demographics | Rating | Rank | Associate's Degree |
| Filipinos | 100.0 /100 | #1 | Exceptional 59.8% |
| Immigrants | Singapore | 100.0 /100 | #2 | Exceptional 58.9% |
| Immigrants | India | 100.0 /100 | #3 | Exceptional 58.5% |
| Immigrants | Taiwan | 100.0 /100 | #4 | Exceptional 58.4% |
| Iranians | 100.0 /100 | #5 | Exceptional 58.2% |
| Okinawans | 100.0 /100 | #6 | Exceptional 57.7% |
| Immigrants | Iran | 100.0 /100 | #7 | Exceptional 57.7% |
| Thais | 100.0 /100 | #8 | Exceptional 57.4% |
| Immigrants | Israel | 100.0 /100 | #9 | Exceptional 56.8% |
| Cypriots | 100.0 /100 | #10 | Exceptional 56.4% |
| Immigrants | Australia | 100.0 /100 | #11 | Exceptional 55.8% |
| Immigrants | South Central Asia | 100.0 /100 | #12 | Exceptional 55.7% |
| Immigrants | China | 100.0 /100 | #13 | Exceptional 55.5% |
| Immigrants | Hong Kong | 100.0 /100 | #14 | Exceptional 55.4% |
| Immigrants | Eastern Asia | 100.0 /100 | #15 | Exceptional 55.4% |
Demographics Similar to Norwegians by Associate's Degree
In terms of associate's degree, the demographic groups most similar to Norwegians are Slavic (47.6%, a difference of 0.060%), Sierra Leonean (47.7%, a difference of 0.23%), Canadian (47.5%, a difference of 0.23%), Taiwanese (47.7%, a difference of 0.28%), and Immigrants from Sudan (47.4%, a difference of 0.36%).
| Demographics | Rating | Rank | Associate's Degree |
| Pakistanis | 88.0 /100 | #136 | Excellent 48.1% |
| Immigrants | Eritrea | 87.8 /100 | #137 | Excellent 48.1% |
| Poles | 87.3 /100 | #138 | Excellent 48.0% |
| Slovenes | 85.1 /100 | #139 | Excellent 47.9% |
| Immigrants | Southern Europe | 84.4 /100 | #140 | Excellent 47.8% |
| Taiwanese | 83.3 /100 | #141 | Excellent 47.7% |
| Sierra Leoneans | 82.9 /100 | #142 | Excellent 47.7% |
| Norwegians | 81.0 /100 | #143 | Excellent 47.6% |
| Slavs | 80.5 /100 | #144 | Excellent 47.6% |
| Canadians | 79.0 /100 | #145 | Good 47.5% |
| Immigrants | Sudan | 77.9 /100 | #146 | Good 47.4% |
| Danes | 77.3 /100 | #147 | Good 47.4% |
| South American Indians | 76.7 /100 | #148 | Good 47.4% |
| Immigrants | Armenia | 76.6 /100 | #149 | Good 47.4% |
| Iraqis | 76.2 /100 | #150 | Good 47.4% |