Immigrants from India vs Iraqi 11th Grade

COMPARE

Immigrants from India
Race
Ancestry
AfghanAfricanAlaska NativeAlaskan AthabascanAlbanianAleutAlsatianAmericanApacheArabArapahoArgentineanArmenianAssyrian/Chaldean/SyriacAustralianAustrianBahamianBangladeshiBarbadianBasqueBelgianBelizeanBermudanBhutaneseBlackfeetBolivianBrazilianBritishBritish West IndianBulgarianBurmeseCajunCambodianCanadianCape VerdeanCarpatho RusynCelticCentral AmericanCentral American IndianCherokeeCheyenneChickasawChileanChineseChippewaChoctawColombianColvilleComancheCosta RicanCreeCreekCroatianCrowCubanCypriotCzechCzechoslovakianDanishDelawareDominicanDutchDutch West IndianEastern EuropeanEcuadorianEgyptianEnglishEstonianEthiopianEuropeanFijianFilipinoFinnishFrenchFrench American IndianFrench CanadianGermanGerman RussianGhanaianGreekGuamanian/ChamorroGuatemalanGuyaneseHaitianHmongHonduranHopiHoumaHungarianIcelanderIndian (Asian)IndonesianInupiatIranianIrishIroquoisIsraeliItalianJamaicanJapaneseJordanianKenyanKiowaKoreanLaotianLatvianLebaneseLiberianLithuanianLumbeeLuxembourgerMacedonianMalaysianMalteseMarshalleseMenomineeMexicanMexican American IndianMongolianMoroccanNative HawaiianNavajoNepaleseNew ZealanderNicaraguanNigerianNorthern EuropeanNorwegianOkinawanOsageOttawaPaiutePakistaniPalestinianPanamanianParaguayanPennsylvania GermanPeruvianPimaPolishPortuguesePotawatomiPuebloPuerto RicanPuget Sound SalishRomanianRussianSalvadoranSamoanScandinavianScotch-IrishScottishSeminoleSenegaleseSerbianShoshoneSierra LeoneanSiouxSlavicSlovakSloveneSomaliSouth AfricanSouth AmericanSouth American IndianSoviet UnionSpaniardSpanishSpanish AmericanSpanish American IndianSri LankanSubsaharan AfricanSudaneseSwedishSwissSyrianTaiwaneseThaiTlingit-HaidaTohono O'OdhamTonganTrinidadian and TobagonianTsimshianTurkishU.S. Virgin IslanderUgandanUkrainianUruguayanUteVenezuelanVietnameseWelshWest IndianYakamaYaquiYugoslavianYumanYup'ikZimbabwean
Immigration
NonimmigrantsImmigrantsAfghanistanAfricaAlbaniaArgentinaArmeniaAsiaAustraliaAustriaBahamasBangladeshBarbadosBelarusBelgiumBelizeBoliviaBosnia and HerzegovinaBrazilBulgariaBurma/MyanmarCabo VerdeCambodiaCameroonCanadaCaribbeanCentral AmericaChileChinaColombiaCongoCosta RicaCroatiaCubaCzechoslovakiaDenmarkDominicaDominican RepublicEastern AfricaEastern AsiaEastern EuropeEcuadorEgyptEl SalvadorEnglandEritreaEthiopiaEuropeFijiFranceGermanyGhanaGreeceGrenadaGuatemalaGuyanaHaitiHondurasHong KongHungaryIndiaIndonesiaIranIraqIrelandIsraelItalyJamaicaJapanJordanKazakhstanKenyaKoreaKuwaitLaosLatin AmericaLatviaLebanonLiberiaLithuaniaMalaysiaMexicoMicronesiaMiddle AfricaMoldovaMoroccoNepalNetherlandsNicaraguaNigeriaNorth AmericaNorth MacedoniaNorthern AfricaNorthern EuropeNorwayOceaniaPakistanPanamaPeruPhilippinesPolandPortugalRomaniaRussiaSaudi ArabiaScotlandSenegalSerbiaSierra LeoneSingaporeSomaliaSouth AfricaSouth AmericaSouth Central AsiaSouth Eastern AsiaSouthern EuropeSpainSri LankaSt. Vincent and the GrenadinesSudanSwedenSwitzerlandSyriaTaiwanThailandTrinidad and TobagoTurkeyUgandaUkraineUruguayUzbekistanVenezuelaVietnamWest IndiesWestern AfricaWestern AsiaWestern EuropeYemenZaireZimbabweAzores
Iraqi
Race
Ancestry
AfghanAfricanAlaska NativeAlaskan AthabascanAlbanianAleutAlsatianAmericanApacheArabArapahoArgentineanArmenianAssyrian/Chaldean/SyriacAustralianAustrianBahamianBangladeshiBarbadianBasqueBelgianBelizeanBermudanBhutaneseBlackfeetBolivianBrazilianBritishBritish West IndianBulgarianBurmeseCajunCambodianCanadianCape VerdeanCarpatho RusynCelticCentral AmericanCentral American IndianCherokeeCheyenneChickasawChileanChineseChippewaChoctawColombianColvilleComancheCosta RicanCreeCreekCroatianCrowCubanCypriotCzechCzechoslovakianDanishDelawareDominicanDutchDutch West IndianEastern EuropeanEcuadorianEgyptianEnglishEstonianEthiopianEuropeanFijianFilipinoFinnishFrenchFrench American IndianFrench CanadianGermanGerman RussianGhanaianGreekGuamanian/ChamorroGuatemalanGuyaneseHaitianHmongHonduranHopiHoumaHungarianIcelanderIndian (Asian)IndonesianInupiatIranianIraqiIrishIroquoisIsraeliItalianJamaicanJapaneseJordanianKenyanKiowaKoreanLaotianLatvianLebaneseLiberianLithuanianLumbeeLuxembourgerMacedonianMalaysianMalteseMarshalleseMenomineeMexicanMexican American IndianMongolianMoroccanNative HawaiianNavajoNepaleseNew ZealanderNicaraguanNigerianNorthern EuropeanNorwegianOkinawanOsageOttawaPaiutePakistaniPalestinianPanamanianParaguayanPennsylvania GermanPeruvianPimaPolishPortuguesePotawatomiPuebloPuerto RicanPuget Sound SalishRomanianRussianSalvadoranSamoanScandinavianScotch-IrishScottishSeminoleSenegaleseSerbianShoshoneSierra LeoneanSiouxSlavicSlovakSloveneSomaliSouth AfricanSouth AmericanSouth American IndianSoviet UnionSpaniardSpanishSpanish AmericanSpanish American IndianSri LankanSubsaharan AfricanSudaneseSwedishSwissSyrianTaiwaneseThaiTlingit-HaidaTohono O'OdhamTonganTrinidadian and TobagonianTsimshianTurkishU.S. Virgin IslanderUgandanUkrainianUruguayanUteVenezuelanVietnameseWelshWest IndianYakamaYaquiYugoslavianYumanYup'ikZimbabwean
Immigration
NonimmigrantsImmigrantsAfghanistanAfricaAlbaniaArgentinaArmeniaAsiaAustraliaAustriaBahamasBangladeshBarbadosBelarusBelgiumBelizeBoliviaBosnia and HerzegovinaBrazilBulgariaBurma/MyanmarCabo VerdeCambodiaCameroonCanadaCaribbeanCentral AmericaChileChinaColombiaCongoCosta RicaCroatiaCubaCzechoslovakiaDenmarkDominicaDominican RepublicEastern AfricaEastern AsiaEastern EuropeEcuadorEgyptEl SalvadorEnglandEritreaEthiopiaEuropeFijiFranceGermanyGhanaGreeceGrenadaGuatemalaGuyanaHaitiHondurasHong KongHungaryIndonesiaIranIraqIrelandIsraelItalyJamaicaJapanJordanKazakhstanKenyaKoreaKuwaitLaosLatin AmericaLatviaLebanonLiberiaLithuaniaMalaysiaMexicoMicronesiaMiddle AfricaMoldovaMoroccoNepalNetherlandsNicaraguaNigeriaNorth AmericaNorth MacedoniaNorthern AfricaNorthern EuropeNorwayOceaniaPakistanPanamaPeruPhilippinesPolandPortugalRomaniaRussiaSaudi ArabiaScotlandSenegalSerbiaSierra LeoneSingaporeSomaliaSouth AfricaSouth AmericaSouth Central AsiaSouth Eastern AsiaSouthern EuropeSpainSri LankaSt. Vincent and the GrenadinesSudanSwedenSwitzerlandSyriaTaiwanThailandTrinidad and TobagoTurkeyUgandaUkraineUruguayUzbekistanVenezuelaVietnamWest IndiesWestern AfricaWestern AsiaWestern EuropeYemenZaireZimbabweAzores
11th Grade
Income
Poverty
Unemployment
Labor Participation
Family Structure
Vehicle Availability
Education Level
Disability

11th Grade Comparison

Immigrants from India

Iraqis

Exceptional
Good
94.5%
11TH GRADE
100.0/ 100
METRIC RATING
16th/ 347
METRIC RANK
92.8%
11TH GRADE
74.2/ 100
METRIC RATING
152nd/ 347
METRIC RANK

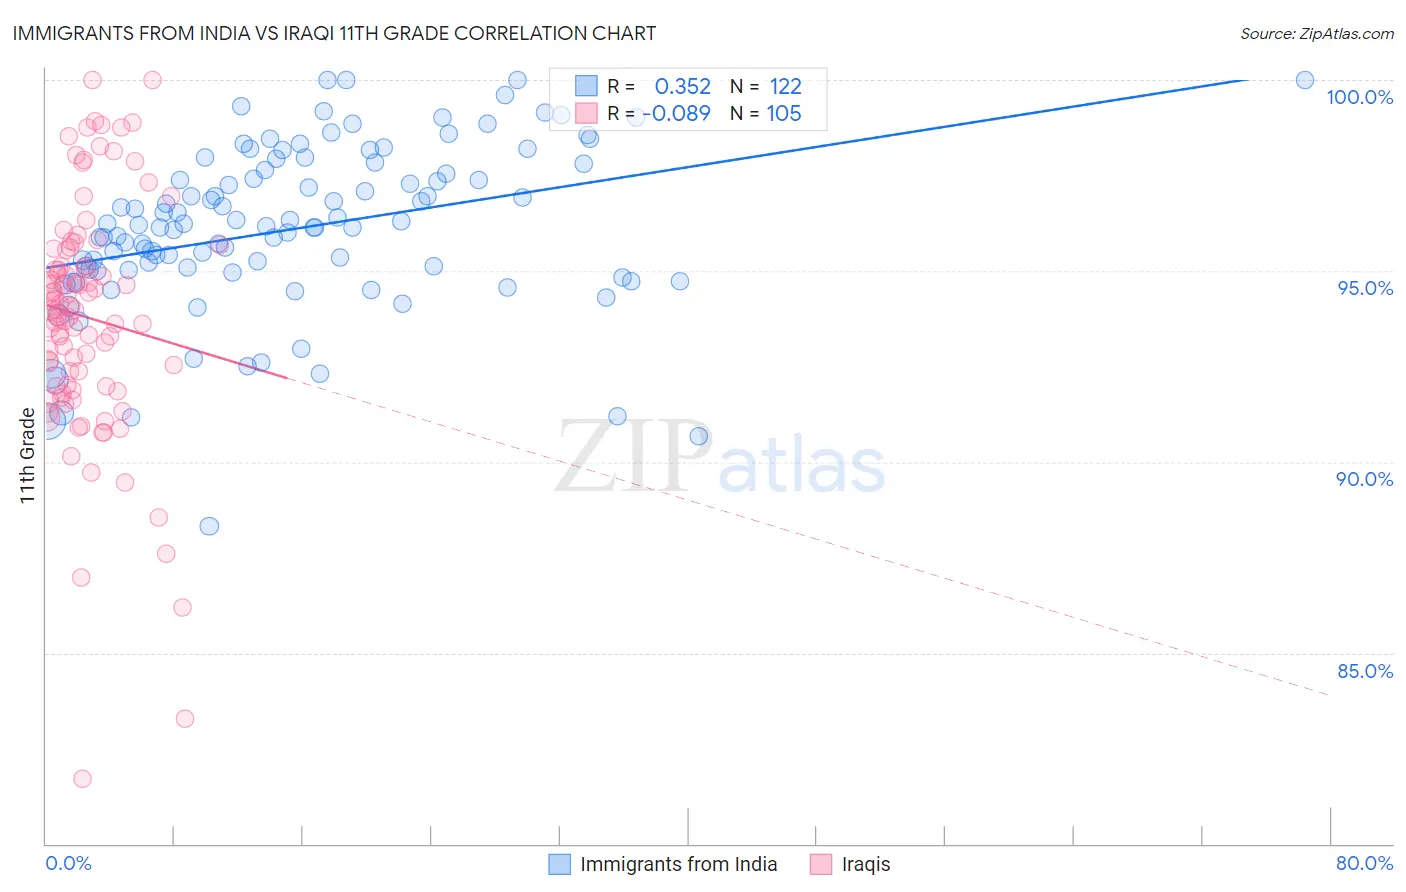
Immigrants from India vs Iraqi 11th Grade Correlation Chart

The statistical analysis conducted on geographies consisting of 434,105,625 people shows a mild positive correlation between the proportion of Immigrants from India and percentage of population with at least 11th grade education in the United States with a correlation coefficient (R) of 0.352 and weighted average of 94.5%. Similarly, the statistical analysis conducted on geographies consisting of 170,614,457 people shows a slight negative correlation between the proportion of Iraqis and percentage of population with at least 11th grade education in the United States with a correlation coefficient (R) of -0.089 and weighted average of 92.8%, a difference of 1.9%.
Immigrants from India vs Iraqi 11th Grade

11th Grade Correlation Summary

MeasurementImmigrants from IndiaIraqi
Minimum88.3%81.7%
Maximum100.0%100.0%
Range11.7%18.3%
Mean96.1%93.8%
Median96.2%94.0%
Interquartile 25% (IQ1)95.0%92.0%
Interquartile 75% (IQ3)97.7%95.6%
Interquartile Range (IQR)2.7%3.6%
Standard Deviation (Sample)2.2%3.1%
Standard Deviation (Population)2.2%3.1%

Similar Demographics by 11th Grade

Demographics Similar to Immigrants from India by 11th Grade

In terms of 11th grade, the demographic groups most similar to Immigrants from India are Luxembourger (94.5%, a difference of 0.0%), Bulgarian (94.5%, a difference of 0.010%), Maltese (94.5%, a difference of 0.010%), Scandinavian (94.5%, a difference of 0.010%), and Italian (94.5%, a difference of 0.040%).
DemographicsRating | Rank11th Grade
Danes
100.0
/100
|
#9
Exceptional
94.7%
Finns
100.0
/100
|
#10
Exceptional
94.7%
Germans
100.0
/100
|
#11
Exceptional
94.7%
Latvians
100.0
/100
|
#12
Exceptional
94.7%
Chinese
100.0
/100
|
#13
Exceptional
94.6%
Eastern Europeans
100.0
/100
|
#14
Exceptional
94.6%
Bulgarians
100.0
/100
|
#15
Exceptional
94.5%
Immigrants | India
100.0
/100
|
#16
Exceptional
94.5%
Luxembourgers
100.0
/100
|
#17
Exceptional
94.5%
Maltese
100.0
/100
|
#18
Exceptional
94.5%
Scandinavians
100.0
/100
|
#19
Exceptional
94.5%
Italians
100.0
/100
|
#20
Exceptional
94.5%
Tlingit-Haida
100.0
/100
|
#21
Exceptional
94.4%
Tsimshian
100.0
/100
|
#22
Exceptional
94.4%
Czechs
100.0
/100
|
#23
Exceptional
94.4%

Demographics Similar to Iraqis by 11th Grade

In terms of 11th grade, the demographic groups most similar to Iraqis are Potawatomi (92.8%, a difference of 0.0%), Brazilian (92.8%, a difference of 0.0%), Osage (92.7%, a difference of 0.010%), Argentinean (92.7%, a difference of 0.010%), and Immigrants from Spain (92.7%, a difference of 0.020%).
DemographicsRating | Rank11th Grade
Pakistanis
79.6
/100
|
#145
Good
92.8%
Iroquois
79.1
/100
|
#146
Good
92.8%
Immigrants | Kenya
78.7
/100
|
#147
Good
92.8%
Hmong
78.6
/100
|
#148
Good
92.8%
Immigrants | Poland
78.5
/100
|
#149
Good
92.8%
Immigrants | Egypt
77.5
/100
|
#150
Good
92.8%
Potawatomi
74.3
/100
|
#151
Good
92.8%
Iraqis
74.2
/100
|
#152
Good
92.8%
Brazilians
73.9
/100
|
#153
Good
92.8%
Osage
73.4
/100
|
#154
Good
92.7%
Argentineans
73.4
/100
|
#155
Good
92.7%
Immigrants | Spain
73.0
/100
|
#156
Good
92.7%
Immigrants | Eastern Asia
72.6
/100
|
#157
Good
92.7%
Immigrants | Venezuela
72.0
/100
|
#158
Good
92.7%
Americans
71.7
/100
|
#159
Good
92.7%