Immigrants from India vs Barbadian 10th Grade
COMPARE
Immigrants from India
Barbadian
10th Grade
10th Grade Comparison
Immigrants from India
Barbadians
95.3%
10TH GRADE
99.9/ 100
METRIC RATING
36th/ 347
METRIC RANK
92.2%
10TH GRADE
0.1/ 100
METRIC RATING
278th/ 347
METRIC RANK
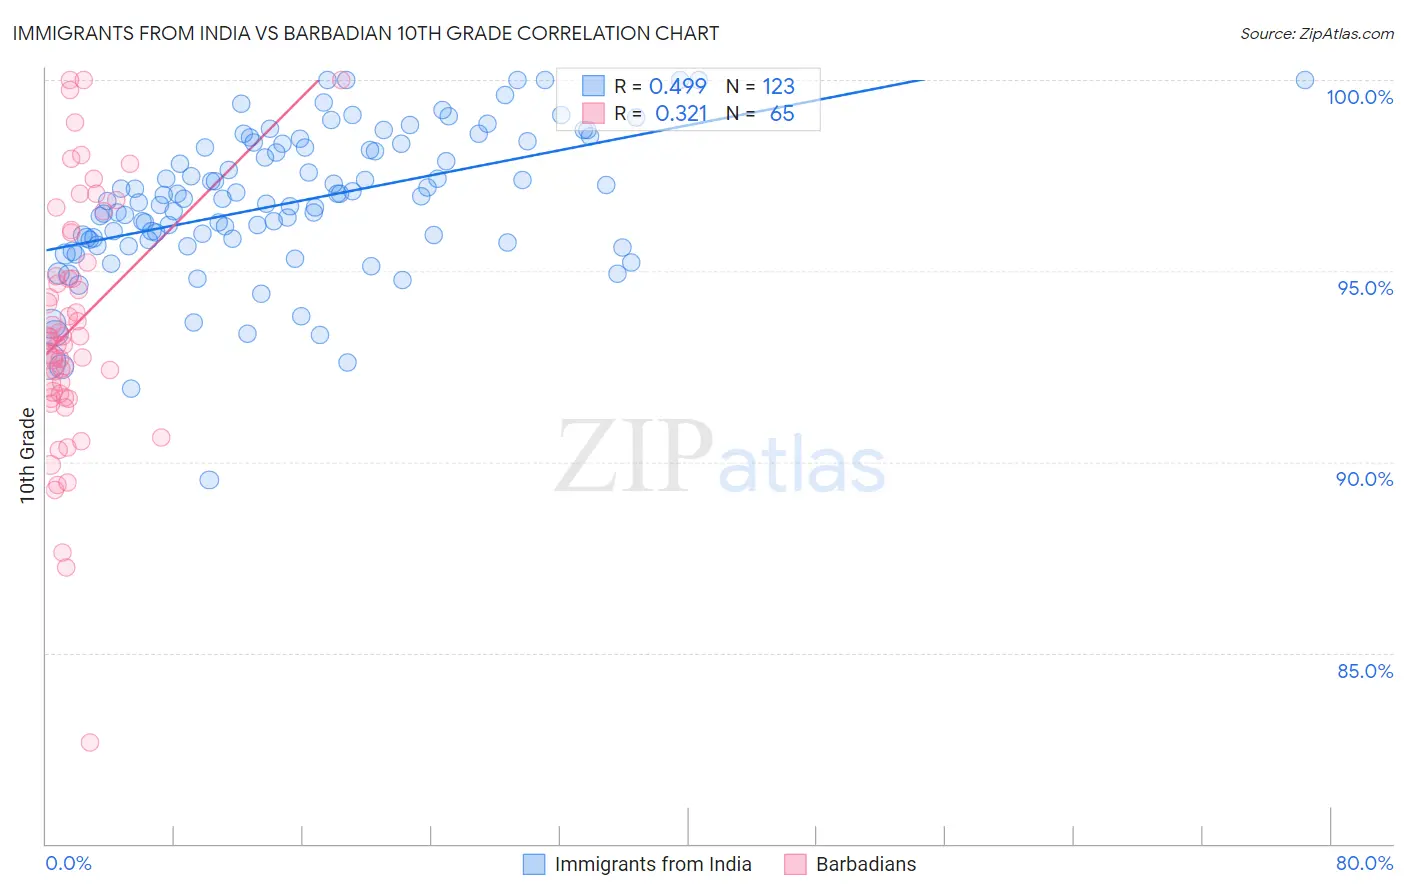
Immigrants from India vs Barbadian 10th Grade Correlation Chart
The statistical analysis conducted on geographies consisting of 434,105,844 people shows a moderate positive correlation between the proportion of Immigrants from India and percentage of population with at least 10th grade education in the United States with a correlation coefficient (R) of 0.499 and weighted average of 95.3%. Similarly, the statistical analysis conducted on geographies consisting of 141,299,083 people shows a mild positive correlation between the proportion of Barbadians and percentage of population with at least 10th grade education in the United States with a correlation coefficient (R) of 0.321 and weighted average of 92.2%, a difference of 3.4%.
10th Grade Correlation Summary
| Measurement | Immigrants from India | Barbadian |
| Minimum | 89.5% | 82.6% |
| Maximum | 100.0% | 100.0% |
| Range | 10.5% | 17.4% |
| Mean | 96.8% | 93.5% |
| Median | 96.9% | 93.3% |
| Interquartile 25% (IQ1) | 95.8% | 91.7% |
| Interquartile 75% (IQ3) | 98.3% | 95.6% |
| Interquartile Range (IQR) | 2.5% | 3.9% |
| Standard Deviation (Sample) | 1.9% | 3.3% |
| Standard Deviation (Population) | 1.9% | 3.2% |
Similar Demographics by 10th Grade
Demographics Similar to Immigrants from India by 10th Grade
In terms of 10th grade, the demographic groups most similar to Immigrants from India are Estonian (95.3%, a difference of 0.010%), Hungarian (95.3%, a difference of 0.020%), French (95.3%, a difference of 0.020%), British (95.3%, a difference of 0.020%), and French Canadian (95.3%, a difference of 0.020%).
| Demographics | Rating | Rank | 10th Grade |
| Bulgarians | 100.0 /100 | #29 | Exceptional 95.4% |
| Belgians | 100.0 /100 | #30 | Exceptional 95.4% |
| Iranians | 100.0 /100 | #31 | Exceptional 95.3% |
| Hungarians | 100.0 /100 | #32 | Exceptional 95.3% |
| French | 100.0 /100 | #33 | Exceptional 95.3% |
| British | 99.9 /100 | #34 | Exceptional 95.3% |
| Estonians | 99.9 /100 | #35 | Exceptional 95.3% |
| Immigrants | India | 99.9 /100 | #36 | Exceptional 95.3% |
| French Canadians | 99.9 /100 | #37 | Exceptional 95.3% |
| Northern Europeans | 99.9 /100 | #38 | Exceptional 95.3% |
| Immigrants | Scotland | 99.9 /100 | #39 | Exceptional 95.2% |
| Scotch-Irish | 99.9 /100 | #40 | Exceptional 95.2% |
| Russians | 99.9 /100 | #41 | Exceptional 95.2% |
| Slavs | 99.9 /100 | #42 | Exceptional 95.2% |
| Macedonians | 99.9 /100 | #43 | Exceptional 95.2% |
Demographics Similar to Barbadians by 10th Grade
In terms of 10th grade, the demographic groups most similar to Barbadians are Native/Alaskan (92.2%, a difference of 0.010%), Navajo (92.3%, a difference of 0.040%), Malaysian (92.2%, a difference of 0.040%), Bangladeshi (92.2%, a difference of 0.040%), and Immigrants from Peru (92.2%, a difference of 0.060%).
| Demographics | Rating | Rank | 10th Grade |
| Immigrants | Eritrea | 0.3 /100 | #271 | Tragic 92.5% |
| Immigrants | Western Africa | 0.3 /100 | #272 | Tragic 92.5% |
| Trinidadians and Tobagonians | 0.2 /100 | #273 | Tragic 92.4% |
| Immigrants | Congo | 0.2 /100 | #274 | Tragic 92.4% |
| West Indians | 0.2 /100 | #275 | Tragic 92.4% |
| Immigrants | Trinidad and Tobago | 0.1 /100 | #276 | Tragic 92.3% |
| Navajo | 0.1 /100 | #277 | Tragic 92.3% |
| Barbadians | 0.1 /100 | #278 | Tragic 92.2% |
| Natives/Alaskans | 0.1 /100 | #279 | Tragic 92.2% |
| Malaysians | 0.1 /100 | #280 | Tragic 92.2% |
| Bangladeshis | 0.1 /100 | #281 | Tragic 92.2% |
| Immigrants | Peru | 0.1 /100 | #282 | Tragic 92.2% |
| Immigrants | St. Vincent and the Grenadines | 0.0 /100 | #283 | Tragic 92.1% |
| Immigrants | Barbados | 0.0 /100 | #284 | Tragic 92.1% |
| Immigrants | South Eastern Asia | 0.0 /100 | #285 | Tragic 92.1% |