Immigrants from Hungary vs Immigrants from Poland 4th Grade

COMPARE

Immigrants from Hungary
Race
Ancestry
AfghanAfricanAlaska NativeAlaskan AthabascanAlbanianAleutAlsatianAmericanApacheArabArapahoArgentineanArmenianAssyrian/Chaldean/SyriacAustralianAustrianBahamianBangladeshiBarbadianBasqueBelgianBelizeanBermudanBhutaneseBlackfeetBolivianBrazilianBritishBritish West IndianBulgarianBurmeseCajunCambodianCanadianCape VerdeanCarpatho RusynCelticCentral AmericanCentral American IndianCherokeeCheyenneChickasawChileanChineseChippewaChoctawColombianColvilleComancheCosta RicanCreeCreekCroatianCrowCubanCypriotCzechCzechoslovakianDanishDelawareDominicanDutchDutch West IndianEastern EuropeanEcuadorianEgyptianEnglishEstonianEthiopianEuropeanFijianFilipinoFinnishFrenchFrench American IndianFrench CanadianGermanGerman RussianGhanaianGreekGuamanian/ChamorroGuatemalanGuyaneseHaitianHmongHonduranHopiHoumaHungarianIcelanderIndian (Asian)IndonesianInupiatIranianIraqiIrishIroquoisIsraeliItalianJamaicanJapaneseJordanianKenyanKiowaKoreanLaotianLatvianLebaneseLiberianLithuanianLumbeeLuxembourgerMacedonianMalaysianMalteseMarshalleseMenomineeMexicanMexican American IndianMongolianMoroccanNative HawaiianNavajoNepaleseNew ZealanderNicaraguanNigerianNorthern EuropeanNorwegianOkinawanOsageOttawaPaiutePakistaniPalestinianPanamanianParaguayanPennsylvania GermanPeruvianPimaPolishPortuguesePotawatomiPuebloPuerto RicanPuget Sound SalishRomanianRussianSalvadoranSamoanScandinavianScotch-IrishScottishSeminoleSenegaleseSerbianShoshoneSierra LeoneanSiouxSlavicSlovakSloveneSomaliSouth AfricanSouth AmericanSouth American IndianSoviet UnionSpaniardSpanishSpanish AmericanSpanish American IndianSri LankanSubsaharan AfricanSudaneseSwedishSwissSyrianTaiwaneseThaiTlingit-HaidaTohono O'OdhamTonganTrinidadian and TobagonianTsimshianTurkishU.S. Virgin IslanderUgandanUkrainianUruguayanUteVenezuelanVietnameseWelshWest IndianYakamaYaquiYugoslavianYumanYup'ikZimbabwean
Immigration
NonimmigrantsImmigrantsAfghanistanAfricaAlbaniaArgentinaArmeniaAsiaAustraliaAustriaBahamasBangladeshBarbadosBelarusBelgiumBelizeBoliviaBosnia and HerzegovinaBrazilBulgariaBurma/MyanmarCabo VerdeCambodiaCameroonCanadaCaribbeanCentral AmericaChileChinaColombiaCongoCosta RicaCroatiaCubaCzechoslovakiaDenmarkDominicaDominican RepublicEastern AfricaEastern AsiaEastern EuropeEcuadorEgyptEl SalvadorEnglandEritreaEthiopiaEuropeFijiFranceGermanyGhanaGreeceGrenadaGuatemalaGuyanaHaitiHondurasHong KongHungaryIndiaIndonesiaIranIraqIrelandIsraelItalyJamaicaJapanJordanKazakhstanKenyaKoreaKuwaitLaosLatin AmericaLatviaLebanonLiberiaLithuaniaMalaysiaMexicoMicronesiaMiddle AfricaMoldovaMoroccoNepalNetherlandsNicaraguaNigeriaNorth AmericaNorth MacedoniaNorthern AfricaNorthern EuropeNorwayOceaniaPakistanPanamaPeruPhilippinesPortugalRomaniaRussiaSaudi ArabiaScotlandSenegalSerbiaSierra LeoneSingaporeSomaliaSouth AfricaSouth AmericaSouth Central AsiaSouth Eastern AsiaSouthern EuropeSpainSri LankaSt. Vincent and the GrenadinesSudanSwedenSwitzerlandSyriaTaiwanThailandTrinidad and TobagoTurkeyUgandaUkraineUruguayUzbekistanVenezuelaVietnamWest IndiesWestern AfricaWestern AsiaWestern EuropeYemenZaireZimbabweAzores
Immigrants from Poland
Race
Ancestry
AfghanAfricanAlaska NativeAlaskan AthabascanAlbanianAleutAlsatianAmericanApacheArabArapahoArgentineanArmenianAssyrian/Chaldean/SyriacAustralianAustrianBahamianBangladeshiBarbadianBasqueBelgianBelizeanBermudanBhutaneseBlackfeetBolivianBrazilianBritishBritish West IndianBulgarianBurmeseCajunCambodianCanadianCape VerdeanCarpatho RusynCelticCentral AmericanCentral American IndianCherokeeCheyenneChickasawChileanChineseChippewaChoctawColombianColvilleComancheCosta RicanCreeCreekCroatianCrowCubanCypriotCzechCzechoslovakianDanishDelawareDominicanDutchDutch West IndianEastern EuropeanEcuadorianEgyptianEnglishEstonianEthiopianEuropeanFijianFilipinoFinnishFrenchFrench American IndianFrench CanadianGermanGerman RussianGhanaianGreekGuamanian/ChamorroGuatemalanGuyaneseHaitianHmongHonduranHopiHoumaHungarianIcelanderIndian (Asian)IndonesianInupiatIranianIraqiIrishIroquoisIsraeliItalianJamaicanJapaneseJordanianKenyanKiowaKoreanLaotianLatvianLebaneseLiberianLithuanianLumbeeLuxembourgerMacedonianMalaysianMalteseMarshalleseMenomineeMexicanMexican American IndianMongolianMoroccanNative HawaiianNavajoNepaleseNew ZealanderNicaraguanNigerianNorthern EuropeanNorwegianOkinawanOsageOttawaPaiutePakistaniPalestinianPanamanianParaguayanPennsylvania GermanPeruvianPimaPolishPortuguesePotawatomiPuebloPuerto RicanPuget Sound SalishRomanianRussianSalvadoranSamoanScandinavianScotch-IrishScottishSeminoleSenegaleseSerbianShoshoneSierra LeoneanSiouxSlavicSlovakSloveneSomaliSouth AfricanSouth AmericanSouth American IndianSoviet UnionSpaniardSpanishSpanish AmericanSpanish American IndianSri LankanSubsaharan AfricanSudaneseSwedishSwissSyrianTaiwaneseThaiTlingit-HaidaTohono O'OdhamTonganTrinidadian and TobagonianTsimshianTurkishU.S. Virgin IslanderUgandanUkrainianUruguayanUteVenezuelanVietnameseWelshWest IndianYakamaYaquiYugoslavianYumanYup'ikZimbabwean
Immigration
NonimmigrantsImmigrantsAfghanistanAfricaAlbaniaArgentinaArmeniaAsiaAustraliaAustriaBahamasBangladeshBarbadosBelarusBelgiumBelizeBoliviaBosnia and HerzegovinaBrazilBulgariaBurma/MyanmarCabo VerdeCambodiaCameroonCanadaCaribbeanCentral AmericaChileChinaColombiaCongoCosta RicaCroatiaCubaCzechoslovakiaDenmarkDominicaDominican RepublicEastern AfricaEastern AsiaEastern EuropeEcuadorEgyptEl SalvadorEnglandEritreaEthiopiaEuropeFijiFranceGermanyGhanaGreeceGrenadaGuatemalaGuyanaHaitiHondurasHong KongIndiaIndonesiaIranIraqIrelandIsraelItalyJamaicaJapanJordanKazakhstanKenyaKoreaKuwaitLaosLatin AmericaLatviaLebanonLiberiaLithuaniaMalaysiaMexicoMicronesiaMiddle AfricaMoldovaMoroccoNepalNetherlandsNicaraguaNigeriaNorth AmericaNorth MacedoniaNorthern AfricaNorthern EuropeNorwayOceaniaPakistanPanamaPeruPhilippinesPolandPortugalRomaniaRussiaSaudi ArabiaScotlandSenegalSerbiaSierra LeoneSingaporeSomaliaSouth AfricaSouth AmericaSouth Central AsiaSouth Eastern AsiaSouthern EuropeSpainSri LankaSt. Vincent and the GrenadinesSudanSwedenSwitzerlandSyriaTaiwanThailandTrinidad and TobagoTurkeyUgandaUkraineUruguayUzbekistanVenezuelaVietnamWest IndiesWestern AfricaWestern AsiaWestern EuropeYemenZaireZimbabweAzores
4th Grade
Income
Poverty
Unemployment
Labor Participation
Family Structure
Vehicle Availability
Education Level
Disability

4th Grade Comparison

Immigrants from Hungary

Immigrants from Poland

Excellent
Average
97.7%
4TH GRADE
89.3/ 100
METRIC RATING
132nd/ 347
METRIC RANK
97.5%
4TH GRADE
55.9/ 100
METRIC RATING
167th/ 347
METRIC RANK

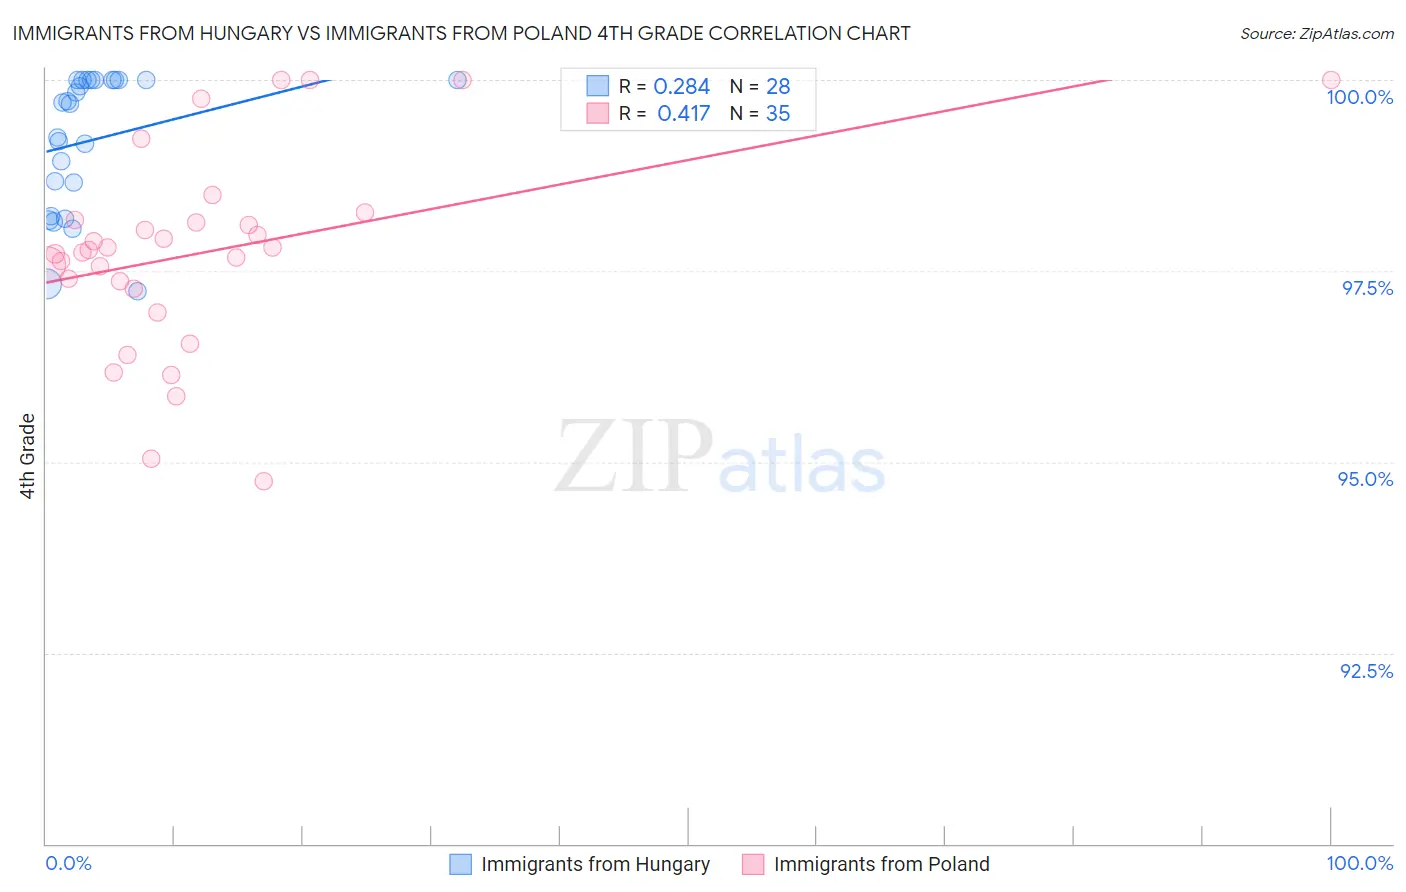
Immigrants from Hungary vs Immigrants from Poland 4th Grade Correlation Chart

The statistical analysis conducted on geographies consisting of 195,707,305 people shows a weak positive correlation between the proportion of Immigrants from Hungary and percentage of population with at least 4th grade education in the United States with a correlation coefficient (R) of 0.284 and weighted average of 97.7%. Similarly, the statistical analysis conducted on geographies consisting of 304,861,559 people shows a moderate positive correlation between the proportion of Immigrants from Poland and percentage of population with at least 4th grade education in the United States with a correlation coefficient (R) of 0.417 and weighted average of 97.5%, a difference of 0.18%.
Immigrants from Hungary vs Immigrants from Poland 4th Grade

4th Grade Correlation Summary

MeasurementImmigrants from HungaryImmigrants from Poland
Minimum97.2%94.8%
Maximum100.0%100.0%
Range2.8%5.2%
Mean99.2%97.7%
Median99.7%97.8%
Interquartile 25% (IQ1)98.4%97.3%
Interquartile 75% (IQ3)100.0%98.2%
Interquartile Range (IQR)1.6%0.90%
Standard Deviation (Sample)0.89%1.3%
Standard Deviation (Population)0.88%1.3%

Similar Demographics by 4th Grade

Demographics Similar to Immigrants from Hungary by 4th Grade

In terms of 4th grade, the demographic groups most similar to Immigrants from Hungary are Immigrants from Kuwait (97.7%, a difference of 0.0%), Immigrants from Romania (97.7%, a difference of 0.010%), Hmong (97.7%, a difference of 0.010%), Palestinian (97.7%, a difference of 0.010%), and Cambodian (97.7%, a difference of 0.010%).
DemographicsRating | Rank4th Grade
Immigrants | Serbia
92.6
/100
|
#125
Exceptional
97.8%
Immigrants | Europe
92.5
/100
|
#126
Exceptional
97.8%
Colville
92.3
/100
|
#127
Exceptional
97.7%
Pima
92.0
/100
|
#128
Exceptional
97.7%
Immigrants | Bulgaria
91.3
/100
|
#129
Exceptional
97.7%
Immigrants | Romania
90.6
/100
|
#130
Exceptional
97.7%
Immigrants | Kuwait
89.7
/100
|
#131
Excellent
97.7%
Immigrants | Hungary
89.3
/100
|
#132
Excellent
97.7%
Hmong
88.2
/100
|
#133
Excellent
97.7%
Palestinians
88.1
/100
|
#134
Excellent
97.7%
Cambodians
87.8
/100
|
#135
Excellent
97.7%
Israelis
86.2
/100
|
#136
Excellent
97.7%
Immigrants | Turkey
86.0
/100
|
#137
Excellent
97.7%
Blackfeet
86.0
/100
|
#138
Excellent
97.7%
Seminole
84.7
/100
|
#139
Excellent
97.7%

Demographics Similar to Immigrants from Poland by 4th Grade

In terms of 4th grade, the demographic groups most similar to Immigrants from Poland are Kenyan (97.5%, a difference of 0.0%), Immigrants from Belarus (97.5%, a difference of 0.0%), Ugandan (97.6%, a difference of 0.010%), Venezuelan (97.6%, a difference of 0.010%), and Chilean (97.5%, a difference of 0.010%).
DemographicsRating | Rank4th Grade
Apache
61.3
/100
|
#160
Good
97.6%
Marshallese
60.8
/100
|
#161
Good
97.6%
Bermudans
60.5
/100
|
#162
Good
97.6%
Immigrants | Iran
60.3
/100
|
#163
Good
97.6%
Ugandans
58.9
/100
|
#164
Average
97.6%
Venezuelans
58.7
/100
|
#165
Average
97.6%
Kenyans
56.5
/100
|
#166
Average
97.5%
Immigrants | Poland
55.9
/100
|
#167
Average
97.5%
Immigrants | Belarus
55.8
/100
|
#168
Average
97.5%
Chileans
54.4
/100
|
#169
Average
97.5%
Immigrants | Spain
51.8
/100
|
#170
Average
97.5%
Brazilians
51.5
/100
|
#171
Average
97.5%
Immigrants | Sri Lanka
51.1
/100
|
#172
Average
97.5%
Immigrants | Korea
50.6
/100
|
#173
Average
97.5%
Egyptians
50.0
/100
|
#174
Average
97.5%