Immigrants from Hungary vs Cypriot 11th Grade
COMPARE
Immigrants from Hungary
Cypriot
11th Grade
11th Grade Comparison
Immigrants from Hungary
Cypriots
93.4%
11TH GRADE
97.5/ 100
METRIC RATING
116th/ 347
METRIC RANK
94.1%
11TH GRADE
99.9/ 100
METRIC RATING
41st/ 347
METRIC RANK
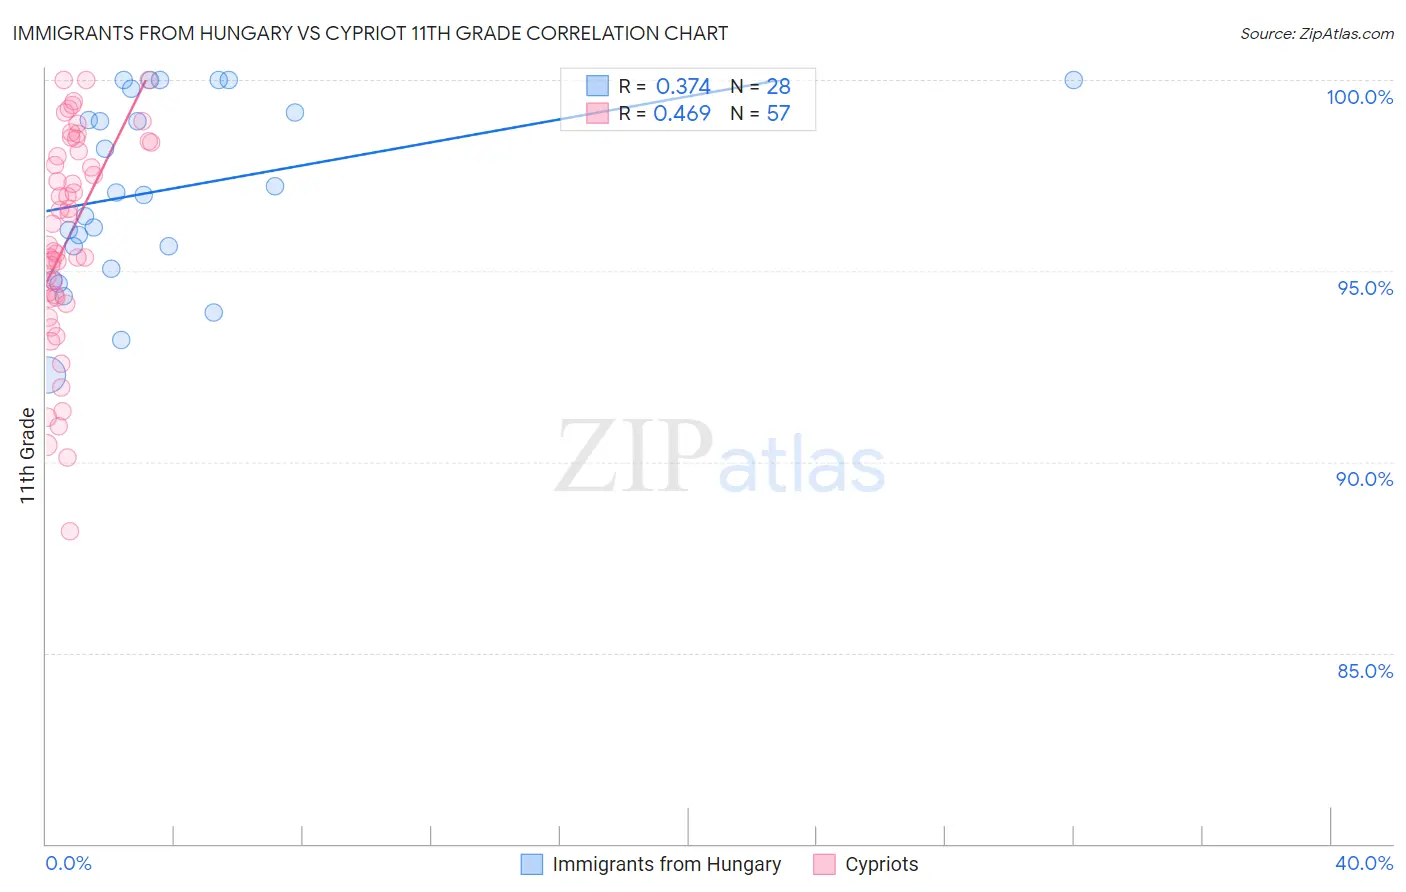
Immigrants from Hungary vs Cypriot 11th Grade Correlation Chart
The statistical analysis conducted on geographies consisting of 195,707,305 people shows a mild positive correlation between the proportion of Immigrants from Hungary and percentage of population with at least 11th grade education in the United States with a correlation coefficient (R) of 0.374 and weighted average of 93.4%. Similarly, the statistical analysis conducted on geographies consisting of 61,870,289 people shows a moderate positive correlation between the proportion of Cypriots and percentage of population with at least 11th grade education in the United States with a correlation coefficient (R) of 0.469 and weighted average of 94.1%, a difference of 0.82%.
11th Grade Correlation Summary
| Measurement | Immigrants from Hungary | Cypriot |
| Minimum | 92.3% | 88.2% |
| Maximum | 100.0% | 100.0% |
| Range | 7.7% | 11.8% |
| Mean | 97.1% | 95.9% |
| Median | 97.0% | 96.2% |
| Interquartile 25% (IQ1) | 95.4% | 94.3% |
| Interquartile 75% (IQ3) | 99.5% | 98.4% |
| Interquartile Range (IQR) | 4.1% | 4.1% |
| Standard Deviation (Sample) | 2.4% | 2.8% |
| Standard Deviation (Population) | 2.3% | 2.8% |
Similar Demographics by 11th Grade
Demographics Similar to Immigrants from Hungary by 11th Grade
In terms of 11th grade, the demographic groups most similar to Immigrants from Hungary are White/Caucasian (93.3%, a difference of 0.010%), Palestinian (93.4%, a difference of 0.020%), Immigrants from Zimbabwe (93.4%, a difference of 0.030%), Jordanian (93.4%, a difference of 0.030%), and Immigrants from Korea (93.3%, a difference of 0.050%).
| Demographics | Rating | Rank | 11th Grade |
| Immigrants | Kuwait | 98.4 /100 | #109 | Exceptional 93.5% |
| Syrians | 98.4 /100 | #110 | Exceptional 93.4% |
| Yugoslavians | 98.1 /100 | #111 | Exceptional 93.4% |
| Immigrants | Germany | 98.0 /100 | #112 | Exceptional 93.4% |
| Immigrants | Zimbabwe | 97.8 /100 | #113 | Exceptional 93.4% |
| Jordanians | 97.8 /100 | #114 | Exceptional 93.4% |
| Palestinians | 97.7 /100 | #115 | Exceptional 93.4% |
| Immigrants | Hungary | 97.5 /100 | #116 | Exceptional 93.4% |
| Whites/Caucasians | 97.4 /100 | #117 | Exceptional 93.3% |
| Immigrants | Korea | 97.0 /100 | #118 | Exceptional 93.3% |
| Israelis | 97.0 /100 | #119 | Exceptional 93.3% |
| Immigrants | Russia | 96.6 /100 | #120 | Exceptional 93.3% |
| German Russians | 96.4 /100 | #121 | Exceptional 93.3% |
| Immigrants | Belarus | 96.3 /100 | #122 | Exceptional 93.3% |
| Immigrants | Greece | 95.9 /100 | #123 | Exceptional 93.2% |
Demographics Similar to Cypriots by 11th Grade
In terms of 11th grade, the demographic groups most similar to Cypriots are Immigrants from Lithuania (94.1%, a difference of 0.010%), Thai (94.1%, a difference of 0.010%), Immigrants from Austria (94.1%, a difference of 0.010%), Greek (94.1%, a difference of 0.010%), and Immigrants from Ireland (94.1%, a difference of 0.020%).
| Demographics | Rating | Rank | 11th Grade |
| Immigrants | Scotland | 99.9 /100 | #34 | Exceptional 94.2% |
| Immigrants | Singapore | 99.9 /100 | #35 | Exceptional 94.2% |
| Immigrants | Northern Europe | 99.9 /100 | #36 | Exceptional 94.2% |
| Northern Europeans | 99.9 /100 | #37 | Exceptional 94.2% |
| Hungarians | 99.9 /100 | #38 | Exceptional 94.2% |
| Immigrants | Lithuania | 99.9 /100 | #39 | Exceptional 94.1% |
| Thais | 99.9 /100 | #40 | Exceptional 94.1% |
| Cypriots | 99.9 /100 | #41 | Exceptional 94.1% |
| Immigrants | Austria | 99.9 /100 | #42 | Exceptional 94.1% |
| Greeks | 99.9 /100 | #43 | Exceptional 94.1% |
| Immigrants | Ireland | 99.9 /100 | #44 | Exceptional 94.1% |
| Australians | 99.9 /100 | #45 | Exceptional 94.1% |
| Serbians | 99.9 /100 | #46 | Exceptional 94.1% |
| Filipinos | 99.9 /100 | #47 | Exceptional 94.1% |
| Macedonians | 99.9 /100 | #48 | Exceptional 94.1% |