Immigrants from Honduras vs Pima Nursery School

COMPARE

Immigrants from Honduras
Race
Ancestry
AfghanAfricanAlaska NativeAlaskan AthabascanAlbanianAleutAlsatianAmericanApacheArabArapahoArgentineanArmenianAssyrian/Chaldean/SyriacAustralianAustrianBahamianBangladeshiBarbadianBasqueBelgianBelizeanBermudanBhutaneseBlackfeetBolivianBrazilianBritishBritish West IndianBulgarianBurmeseCajunCambodianCanadianCape VerdeanCarpatho RusynCelticCentral AmericanCentral American IndianCherokeeCheyenneChickasawChileanChineseChippewaChoctawColombianColvilleComancheCosta RicanCreeCreekCroatianCrowCubanCypriotCzechCzechoslovakianDanishDelawareDominicanDutchDutch West IndianEastern EuropeanEcuadorianEgyptianEnglishEstonianEthiopianEuropeanFijianFilipinoFinnishFrenchFrench American IndianFrench CanadianGermanGerman RussianGhanaianGreekGuamanian/ChamorroGuatemalanGuyaneseHaitianHmongHonduranHopiHoumaHungarianIcelanderIndian (Asian)IndonesianInupiatIranianIraqiIrishIroquoisIsraeliItalianJamaicanJapaneseJordanianKenyanKiowaKoreanLaotianLatvianLebaneseLiberianLithuanianLumbeeLuxembourgerMacedonianMalaysianMalteseMarshalleseMenomineeMexicanMexican American IndianMongolianMoroccanNative HawaiianNavajoNepaleseNew ZealanderNicaraguanNigerianNorthern EuropeanNorwegianOkinawanOsageOttawaPaiutePakistaniPalestinianPanamanianParaguayanPennsylvania GermanPeruvianPolishPortuguesePotawatomiPuebloPuerto RicanPuget Sound SalishRomanianRussianSalvadoranSamoanScandinavianScotch-IrishScottishSeminoleSenegaleseSerbianShoshoneSierra LeoneanSiouxSlavicSlovakSloveneSomaliSouth AfricanSouth AmericanSouth American IndianSoviet UnionSpaniardSpanishSpanish AmericanSpanish American IndianSri LankanSubsaharan AfricanSudaneseSwedishSwissSyrianTaiwaneseThaiTlingit-HaidaTohono O'OdhamTonganTrinidadian and TobagonianTsimshianTurkishU.S. Virgin IslanderUgandanUkrainianUruguayanUteVenezuelanVietnameseWelshWest IndianYakamaYaquiYugoslavianYumanYup'ikZimbabwean
Immigration
NonimmigrantsImmigrantsAfghanistanAfricaAlbaniaArgentinaArmeniaAsiaAustraliaAustriaBahamasBangladeshBarbadosBelarusBelgiumBelizeBoliviaBosnia and HerzegovinaBrazilBulgariaBurma/MyanmarCabo VerdeCambodiaCameroonCanadaCaribbeanCentral AmericaChileChinaColombiaCongoCosta RicaCroatiaCubaCzechoslovakiaDenmarkDominicaDominican RepublicEastern AfricaEastern AsiaEastern EuropeEcuadorEgyptEl SalvadorEnglandEritreaEthiopiaEuropeFijiFranceGermanyGhanaGreeceGrenadaGuatemalaGuyanaHaitiHondurasHong KongHungaryIndiaIndonesiaIranIraqIrelandIsraelItalyJamaicaJapanJordanKazakhstanKenyaKoreaKuwaitLaosLatin AmericaLatviaLebanonLiberiaLithuaniaMalaysiaMexicoMicronesiaMiddle AfricaMoldovaMoroccoNepalNetherlandsNicaraguaNigeriaNorth AmericaNorth MacedoniaNorthern AfricaNorthern EuropeNorwayOceaniaPakistanPanamaPeruPhilippinesPolandPortugalRomaniaRussiaSaudi ArabiaScotlandSenegalSerbiaSierra LeoneSingaporeSomaliaSouth AfricaSouth AmericaSouth Central AsiaSouth Eastern AsiaSouthern EuropeSpainSri LankaSt. Vincent and the GrenadinesSudanSwedenSwitzerlandSyriaTaiwanThailandTrinidad and TobagoTurkeyUgandaUkraineUruguayUzbekistanVenezuelaVietnamWest IndiesWestern AfricaWestern AsiaWestern EuropeYemenZaireZimbabweAzores
Pima
Race
Ancestry
AfghanAfricanAlaska NativeAlaskan AthabascanAlbanianAleutAlsatianAmericanApacheArabArapahoArgentineanArmenianAssyrian/Chaldean/SyriacAustralianAustrianBahamianBangladeshiBarbadianBasqueBelgianBelizeanBermudanBhutaneseBlackfeetBolivianBrazilianBritishBritish West IndianBulgarianBurmeseCajunCambodianCanadianCape VerdeanCarpatho RusynCelticCentral AmericanCentral American IndianCherokeeCheyenneChickasawChileanChineseChippewaChoctawColombianColvilleComancheCosta RicanCreeCreekCroatianCrowCubanCypriotCzechCzechoslovakianDanishDelawareDominicanDutchDutch West IndianEastern EuropeanEcuadorianEgyptianEnglishEstonianEthiopianEuropeanFijianFilipinoFinnishFrenchFrench American IndianFrench CanadianGermanGerman RussianGhanaianGreekGuamanian/ChamorroGuatemalanGuyaneseHaitianHmongHonduranHopiHoumaHungarianIcelanderIndian (Asian)IndonesianInupiatIranianIraqiIrishIroquoisIsraeliItalianJamaicanJapaneseJordanianKenyanKiowaKoreanLaotianLatvianLebaneseLiberianLithuanianLumbeeLuxembourgerMacedonianMalaysianMalteseMarshalleseMenomineeMexicanMexican American IndianMongolianMoroccanNative HawaiianNavajoNepaleseNew ZealanderNicaraguanNigerianNorthern EuropeanNorwegianOkinawanOsageOttawaPaiutePakistaniPalestinianPanamanianParaguayanPennsylvania GermanPeruvianPimaPolishPortuguesePotawatomiPuebloPuerto RicanPuget Sound SalishRomanianRussianSalvadoranSamoanScandinavianScotch-IrishScottishSeminoleSenegaleseSerbianShoshoneSierra LeoneanSiouxSlavicSlovakSloveneSomaliSouth AfricanSouth AmericanSouth American IndianSoviet UnionSpaniardSpanishSpanish AmericanSpanish American IndianSri LankanSubsaharan AfricanSudaneseSwedishSwissSyrianTaiwaneseThaiTlingit-HaidaTohono O'OdhamTonganTrinidadian and TobagonianTsimshianTurkishU.S. Virgin IslanderUgandanUkrainianUruguayanUteVenezuelanVietnameseWelshWest IndianYakamaYaquiYugoslavianYumanYup'ikZimbabwean
Immigration
NonimmigrantsImmigrantsAfghanistanAfricaAlbaniaArgentinaArmeniaAsiaAustraliaAustriaBahamasBangladeshBarbadosBelarusBelgiumBelizeBoliviaBosnia and HerzegovinaBrazilBulgariaBurma/MyanmarCabo VerdeCambodiaCameroonCanadaCaribbeanCentral AmericaChileChinaColombiaCongoCosta RicaCroatiaCubaCzechoslovakiaDenmarkDominicaDominican RepublicEastern AfricaEastern AsiaEastern EuropeEcuadorEgyptEl SalvadorEnglandEritreaEthiopiaEuropeFijiFranceGermanyGhanaGreeceGrenadaGuatemalaGuyanaHaitiHong KongHungaryIndiaIndonesiaIranIraqIrelandIsraelItalyJamaicaJapanJordanKazakhstanKenyaKoreaKuwaitLaosLatin AmericaLatviaLebanonLiberiaLithuaniaMalaysiaMexicoMicronesiaMiddle AfricaMoldovaMoroccoNepalNetherlandsNicaraguaNigeriaNorth AmericaNorth MacedoniaNorthern AfricaNorthern EuropeNorwayOceaniaPakistanPanamaPeruPhilippinesPolandPortugalRomaniaRussiaSaudi ArabiaScotlandSenegalSerbiaSierra LeoneSingaporeSomaliaSouth AfricaSouth AmericaSouth Central AsiaSouth Eastern AsiaSouthern EuropeSpainSri LankaSt. Vincent and the GrenadinesSudanSwedenSwitzerlandSyriaTaiwanThailandTrinidad and TobagoTurkeyUgandaUkraineUruguayUzbekistanVenezuelaVietnamWest IndiesWestern AfricaWestern AsiaWestern EuropeYemenZaireZimbabweAzores
Nursery School
Income
Poverty
Unemployment
Labor Participation
Family Structure
Vehicle Availability
Education Level
Disability

Nursery School Comparison

Immigrants from Honduras

Pima

Tragic
Exceptional
96.9%
NURSERY SCHOOL
0.0/ 100
METRIC RATING
323rd/ 347
METRIC RANK
98.2%
NURSERY SCHOOL
97.1/ 100
METRIC RATING
108th/ 347
METRIC RANK

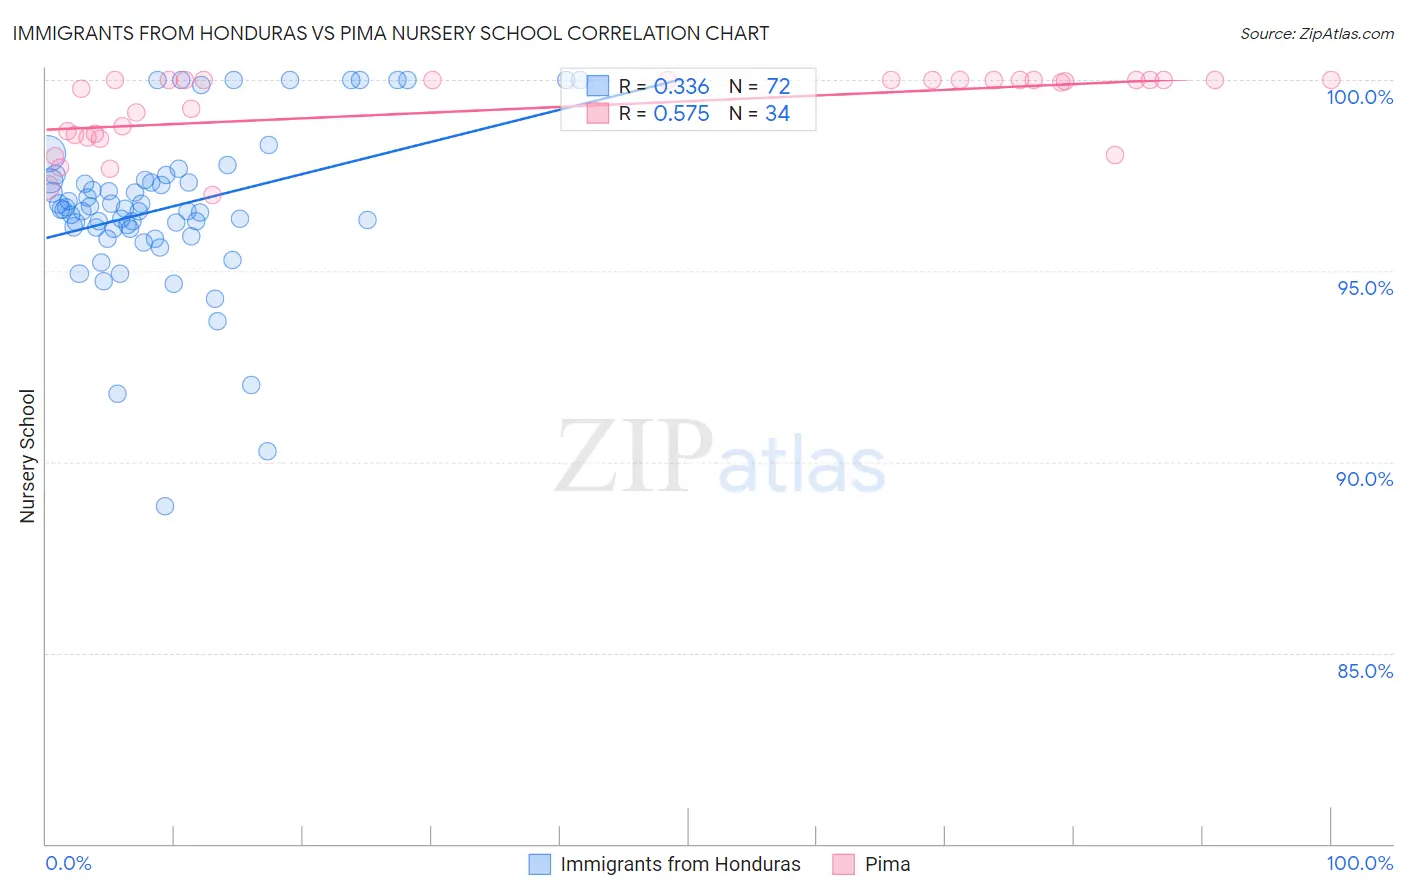
Immigrants from Honduras vs Pima Nursery School Correlation Chart

The statistical analysis conducted on geographies consisting of 322,637,445 people shows a mild positive correlation between the proportion of Immigrants from Honduras and percentage of population with at least nursery school education in the United States with a correlation coefficient (R) of 0.336 and weighted average of 96.9%. Similarly, the statistical analysis conducted on geographies consisting of 61,552,942 people shows a substantial positive correlation between the proportion of Pima and percentage of population with at least nursery school education in the United States with a correlation coefficient (R) of 0.575 and weighted average of 98.2%, a difference of 1.4%.
Immigrants from Honduras vs Pima Nursery School

Nursery School Correlation Summary

MeasurementImmigrants from HondurasPima
Minimum88.8%97.0%
Maximum100.0%100.0%
Range11.2%3.0%
Mean96.7%99.3%
Median96.6%100.0%
Interquartile 25% (IQ1)96.1%98.6%
Interquartile 75% (IQ3)97.4%100.0%
Interquartile Range (IQR)1.3%1.4%
Standard Deviation (Sample)2.1%0.97%
Standard Deviation (Population)2.1%0.95%

Similar Demographics by Nursery School

Demographics Similar to Immigrants from Honduras by Nursery School

In terms of nursery school, the demographic groups most similar to Immigrants from Honduras are Mexican American Indian (96.9%, a difference of 0.0%), Vietnamese (96.8%, a difference of 0.010%), Immigrants from Bangladesh (96.9%, a difference of 0.020%), Immigrants from Laos (96.9%, a difference of 0.030%), and Immigrants from Burma/Myanmar (96.9%, a difference of 0.030%).
DemographicsRating | RankNursery School
Immigrants | Belize
0.0
/100
|
#316
Tragic
96.9%
Immigrants | Ecuador
0.0
/100
|
#317
Tragic
96.9%
Immigrants | Guyana
0.0
/100
|
#318
Tragic
96.9%
Immigrants | Laos
0.0
/100
|
#319
Tragic
96.9%
Immigrants | Burma/Myanmar
0.0
/100
|
#320
Tragic
96.9%
Immigrants | Bangladesh
0.0
/100
|
#321
Tragic
96.9%
Mexican American Indians
0.0
/100
|
#322
Tragic
96.9%
Immigrants | Honduras
0.0
/100
|
#323
Tragic
96.9%
Vietnamese
0.0
/100
|
#324
Tragic
96.8%
Dominicans
0.0
/100
|
#325
Tragic
96.8%
Indonesians
0.0
/100
|
#326
Tragic
96.8%
Mexicans
0.0
/100
|
#327
Tragic
96.8%
Immigrants | Latin America
0.0
/100
|
#328
Tragic
96.7%
Immigrants | Vietnam
0.0
/100
|
#329
Tragic
96.7%
Japanese
0.0
/100
|
#330
Tragic
96.7%

Demographics Similar to Pima by Nursery School

In terms of nursery school, the demographic groups most similar to Pima are German Russian (98.2%, a difference of 0.0%), Bhutanese (98.2%, a difference of 0.010%), Turkish (98.2%, a difference of 0.010%), Immigrants from Switzerland (98.2%, a difference of 0.010%), and Basque (98.2%, a difference of 0.010%).
DemographicsRating | RankNursery School
Romanians
97.9
/100
|
#101
Exceptional
98.3%
Immigrants | Ireland
97.7
/100
|
#102
Exceptional
98.3%
Cree
97.7
/100
|
#103
Exceptional
98.3%
Bhutanese
97.4
/100
|
#104
Exceptional
98.2%
Turks
97.4
/100
|
#105
Exceptional
98.2%
Immigrants | Switzerland
97.3
/100
|
#106
Exceptional
98.2%
Basques
97.3
/100
|
#107
Exceptional
98.2%
Pima
97.1
/100
|
#108
Exceptional
98.2%
German Russians
97.1
/100
|
#109
Exceptional
98.2%
Immigrants | Singapore
96.9
/100
|
#110
Exceptional
98.2%
Immigrants | Czechoslovakia
96.8
/100
|
#111
Exceptional
98.2%
Immigrants | Norway
96.6
/100
|
#112
Exceptional
98.2%
Immigrants | Latvia
96.4
/100
|
#113
Exceptional
98.2%
Ute
96.4
/100
|
#114
Exceptional
98.2%
Iranians
96.3
/100
|
#115
Exceptional
98.2%