Immigrants from Honduras vs Hawaiian Bachelor's Degree
COMPARE
Immigrants from Honduras
Hawaiian
Bachelor's Degree
Bachelor's Degree Comparison
Immigrants from Honduras
Hawaiians
30.9%
BACHELOR'S DEGREE
0.1/ 100
METRIC RATING
290th/ 347
METRIC RANK
31.6%
BACHELOR'S DEGREE
0.1/ 100
METRIC RATING
279th/ 347
METRIC RANK
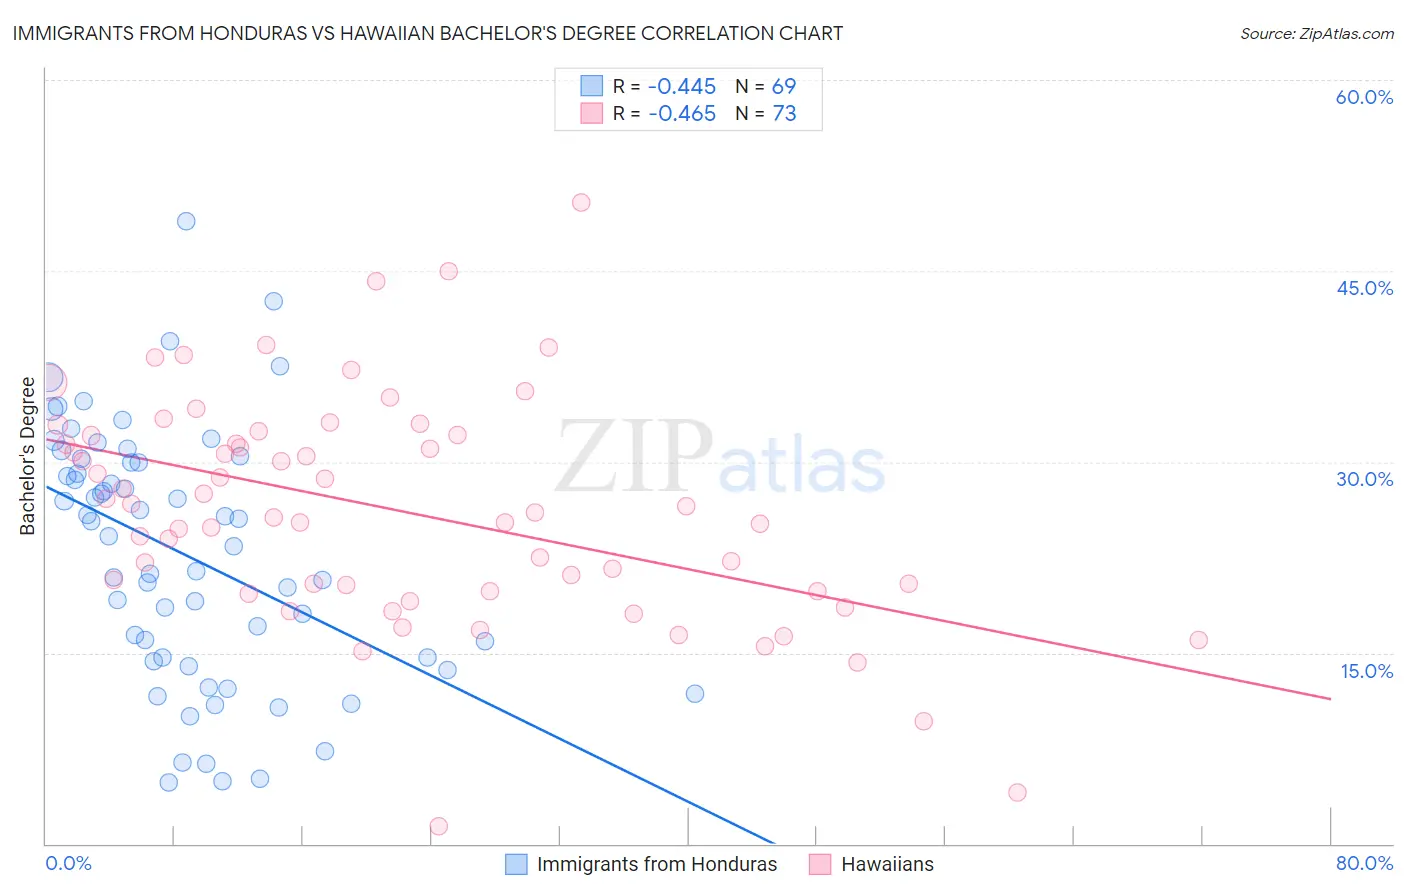
Immigrants from Honduras vs Hawaiian Bachelor's Degree Correlation Chart
The statistical analysis conducted on geographies consisting of 322,614,162 people shows a moderate negative correlation between the proportion of Immigrants from Honduras and percentage of population with at least bachelor's degree education in the United States with a correlation coefficient (R) of -0.445 and weighted average of 30.9%. Similarly, the statistical analysis conducted on geographies consisting of 327,580,632 people shows a moderate negative correlation between the proportion of Hawaiians and percentage of population with at least bachelor's degree education in the United States with a correlation coefficient (R) of -0.465 and weighted average of 31.6%, a difference of 2.2%.
Bachelor's Degree Correlation Summary
| Measurement | Immigrants from Honduras | Hawaiian |
| Minimum | 4.8% | 1.4% |
| Maximum | 48.9% | 50.4% |
| Range | 44.1% | 49.0% |
| Mean | 22.7% | 26.2% |
| Median | 24.2% | 26.0% |
| Interquartile 25% (IQ1) | 14.4% | 19.8% |
| Interquartile 75% (IQ3) | 30.1% | 32.1% |
| Interquartile Range (IQR) | 15.7% | 12.3% |
| Standard Deviation (Sample) | 9.9% | 8.9% |
| Standard Deviation (Population) | 9.8% | 8.9% |
Demographics Similar to Immigrants from Honduras and Hawaiians by Bachelor's Degree
In terms of bachelor's degree, the demographic groups most similar to Immigrants from Honduras are Puerto Rican (31.0%, a difference of 0.040%), Black/African American (30.9%, a difference of 0.040%), Ute (30.9%, a difference of 0.12%), Guatemalan (31.0%, a difference of 0.18%), and Cape Verdean (30.9%, a difference of 0.21%). Similarly, the demographic groups most similar to Hawaiians are Immigrants from Laos (31.6%, a difference of 0.050%), Marshallese (31.7%, a difference of 0.35%), Dominican (31.8%, a difference of 0.40%), Blackfeet (31.5%, a difference of 0.51%), and Salvadoran (31.8%, a difference of 0.55%).
| Demographics | Rating | Rank | Bachelor's Degree |
| Potawatomi | 0.2 /100 | #274 | Tragic 31.9% |
| Samoans | 0.1 /100 | #275 | Tragic 31.8% |
| Salvadorans | 0.1 /100 | #276 | Tragic 31.8% |
| Dominicans | 0.1 /100 | #277 | Tragic 31.8% |
| Marshallese | 0.1 /100 | #278 | Tragic 31.7% |
| Hawaiians | 0.1 /100 | #279 | Tragic 31.6% |
| Immigrants | Laos | 0.1 /100 | #280 | Tragic 31.6% |
| Blackfeet | 0.1 /100 | #281 | Tragic 31.5% |
| Immigrants | Caribbean | 0.1 /100 | #282 | Tragic 31.4% |
| Hondurans | 0.1 /100 | #283 | Tragic 31.3% |
| Haitians | 0.1 /100 | #284 | Tragic 31.3% |
| Aleuts | 0.1 /100 | #285 | Tragic 31.3% |
| Immigrants | El Salvador | 0.1 /100 | #286 | Tragic 31.3% |
| Ottawa | 0.1 /100 | #287 | Tragic 31.1% |
| Guatemalans | 0.1 /100 | #288 | Tragic 31.0% |
| Puerto Ricans | 0.1 /100 | #289 | Tragic 31.0% |
| Immigrants | Honduras | 0.1 /100 | #290 | Tragic 30.9% |
| Blacks/African Americans | 0.1 /100 | #291 | Tragic 30.9% |
| Ute | 0.1 /100 | #292 | Tragic 30.9% |
| Cape Verdeans | 0.1 /100 | #293 | Tragic 30.9% |
| Immigrants | Guatemala | 0.0 /100 | #294 | Tragic 30.8% |