Immigrants from Honduras vs Estonian Professional Degree

COMPARE

Immigrants from Honduras
Race
Ancestry
AfghanAfricanAlaska NativeAlaskan AthabascanAlbanianAleutAlsatianAmericanApacheArabArapahoArgentineanArmenianAssyrian/Chaldean/SyriacAustralianAustrianBahamianBangladeshiBarbadianBasqueBelgianBelizeanBermudanBhutaneseBlackfeetBolivianBrazilianBritishBritish West IndianBulgarianBurmeseCajunCambodianCanadianCape VerdeanCarpatho RusynCelticCentral AmericanCentral American IndianCherokeeCheyenneChickasawChileanChineseChippewaChoctawColombianColvilleComancheCosta RicanCreeCreekCroatianCrowCubanCypriotCzechCzechoslovakianDanishDelawareDominicanDutchDutch West IndianEastern EuropeanEcuadorianEgyptianEnglishEthiopianEuropeanFijianFilipinoFinnishFrenchFrench American IndianFrench CanadianGermanGerman RussianGhanaianGreekGuamanian/ChamorroGuatemalanGuyaneseHaitianHmongHonduranHopiHoumaHungarianIcelanderIndian (Asian)IndonesianInupiatIranianIraqiIrishIroquoisIsraeliItalianJamaicanJapaneseJordanianKenyanKiowaKoreanLaotianLatvianLebaneseLiberianLithuanianLumbeeLuxembourgerMacedonianMalaysianMalteseMarshalleseMenomineeMexicanMexican American IndianMongolianMoroccanNative HawaiianNavajoNepaleseNew ZealanderNicaraguanNigerianNorthern EuropeanNorwegianOkinawanOsageOttawaPaiutePakistaniPalestinianPanamanianParaguayanPennsylvania GermanPeruvianPimaPolishPortuguesePotawatomiPuebloPuerto RicanPuget Sound SalishRomanianRussianSalvadoranSamoanScandinavianScotch-IrishScottishSeminoleSenegaleseSerbianShoshoneSierra LeoneanSiouxSlavicSlovakSloveneSomaliSouth AfricanSouth AmericanSouth American IndianSoviet UnionSpaniardSpanishSpanish AmericanSpanish American IndianSri LankanSubsaharan AfricanSudaneseSwedishSwissSyrianTaiwaneseThaiTlingit-HaidaTohono O'OdhamTonganTrinidadian and TobagonianTsimshianTurkishU.S. Virgin IslanderUgandanUkrainianUruguayanUteVenezuelanVietnameseWelshWest IndianYakamaYaquiYugoslavianYumanYup'ikZimbabwean
Immigration
NonimmigrantsImmigrantsAfghanistanAfricaAlbaniaArgentinaArmeniaAsiaAustraliaAustriaBahamasBangladeshBarbadosBelarusBelgiumBelizeBoliviaBosnia and HerzegovinaBrazilBulgariaBurma/MyanmarCabo VerdeCambodiaCameroonCanadaCaribbeanCentral AmericaChileChinaColombiaCongoCosta RicaCroatiaCubaCzechoslovakiaDenmarkDominicaDominican RepublicEastern AfricaEastern AsiaEastern EuropeEcuadorEgyptEl SalvadorEnglandEritreaEthiopiaEuropeFijiFranceGermanyGhanaGreeceGrenadaGuatemalaGuyanaHaitiHondurasHong KongHungaryIndiaIndonesiaIranIraqIrelandIsraelItalyJamaicaJapanJordanKazakhstanKenyaKoreaKuwaitLaosLatin AmericaLatviaLebanonLiberiaLithuaniaMalaysiaMexicoMicronesiaMiddle AfricaMoldovaMoroccoNepalNetherlandsNicaraguaNigeriaNorth AmericaNorth MacedoniaNorthern AfricaNorthern EuropeNorwayOceaniaPakistanPanamaPeruPhilippinesPolandPortugalRomaniaRussiaSaudi ArabiaScotlandSenegalSerbiaSierra LeoneSingaporeSomaliaSouth AfricaSouth AmericaSouth Central AsiaSouth Eastern AsiaSouthern EuropeSpainSri LankaSt. Vincent and the GrenadinesSudanSwedenSwitzerlandSyriaTaiwanThailandTrinidad and TobagoTurkeyUgandaUkraineUruguayUzbekistanVenezuelaVietnamWest IndiesWestern AfricaWestern AsiaWestern EuropeYemenZaireZimbabweAzores
Estonian
Race
Ancestry
AfghanAfricanAlaska NativeAlaskan AthabascanAlbanianAleutAlsatianAmericanApacheArabArapahoArgentineanArmenianAssyrian/Chaldean/SyriacAustralianAustrianBahamianBangladeshiBarbadianBasqueBelgianBelizeanBermudanBhutaneseBlackfeetBolivianBrazilianBritishBritish West IndianBulgarianBurmeseCajunCambodianCanadianCape VerdeanCarpatho RusynCelticCentral AmericanCentral American IndianCherokeeCheyenneChickasawChileanChineseChippewaChoctawColombianColvilleComancheCosta RicanCreeCreekCroatianCrowCubanCypriotCzechCzechoslovakianDanishDelawareDominicanDutchDutch West IndianEastern EuropeanEcuadorianEgyptianEnglishEstonianEthiopianEuropeanFijianFilipinoFinnishFrenchFrench American IndianFrench CanadianGermanGerman RussianGhanaianGreekGuamanian/ChamorroGuatemalanGuyaneseHaitianHmongHonduranHopiHoumaHungarianIcelanderIndian (Asian)IndonesianInupiatIranianIraqiIrishIroquoisIsraeliItalianJamaicanJapaneseJordanianKenyanKiowaKoreanLaotianLatvianLebaneseLiberianLithuanianLumbeeLuxembourgerMacedonianMalaysianMalteseMarshalleseMenomineeMexicanMexican American IndianMongolianMoroccanNative HawaiianNavajoNepaleseNew ZealanderNicaraguanNigerianNorthern EuropeanNorwegianOkinawanOsageOttawaPaiutePakistaniPalestinianPanamanianParaguayanPennsylvania GermanPeruvianPimaPolishPortuguesePotawatomiPuebloPuerto RicanPuget Sound SalishRomanianRussianSalvadoranSamoanScandinavianScotch-IrishScottishSeminoleSenegaleseSerbianShoshoneSierra LeoneanSiouxSlavicSlovakSloveneSomaliSouth AfricanSouth AmericanSouth American IndianSoviet UnionSpaniardSpanishSpanish AmericanSpanish American IndianSri LankanSubsaharan AfricanSudaneseSwedishSwissSyrianTaiwaneseThaiTlingit-HaidaTohono O'OdhamTonganTrinidadian and TobagonianTsimshianTurkishU.S. Virgin IslanderUgandanUkrainianUruguayanUteVenezuelanVietnameseWelshWest IndianYakamaYaquiYugoslavianYumanYup'ikZimbabwean
Immigration
NonimmigrantsImmigrantsAfghanistanAfricaAlbaniaArgentinaArmeniaAsiaAustraliaAustriaBahamasBangladeshBarbadosBelarusBelgiumBelizeBoliviaBosnia and HerzegovinaBrazilBulgariaBurma/MyanmarCabo VerdeCambodiaCameroonCanadaCaribbeanCentral AmericaChileChinaColombiaCongoCosta RicaCroatiaCubaCzechoslovakiaDenmarkDominicaDominican RepublicEastern AfricaEastern AsiaEastern EuropeEcuadorEgyptEl SalvadorEnglandEritreaEthiopiaEuropeFijiFranceGermanyGhanaGreeceGrenadaGuatemalaGuyanaHaitiHong KongHungaryIndiaIndonesiaIranIraqIrelandIsraelItalyJamaicaJapanJordanKazakhstanKenyaKoreaKuwaitLaosLatin AmericaLatviaLebanonLiberiaLithuaniaMalaysiaMexicoMicronesiaMiddle AfricaMoldovaMoroccoNepalNetherlandsNicaraguaNigeriaNorth AmericaNorth MacedoniaNorthern AfricaNorthern EuropeNorwayOceaniaPakistanPanamaPeruPhilippinesPolandPortugalRomaniaRussiaSaudi ArabiaScotlandSenegalSerbiaSierra LeoneSingaporeSomaliaSouth AfricaSouth AmericaSouth Central AsiaSouth Eastern AsiaSouthern EuropeSpainSri LankaSt. Vincent and the GrenadinesSudanSwedenSwitzerlandSyriaTaiwanThailandTrinidad and TobagoTurkeyUgandaUkraineUruguayUzbekistanVenezuelaVietnamWest IndiesWestern AfricaWestern AsiaWestern EuropeYemenZaireZimbabweAzores
Professional Degree
Income
Poverty
Unemployment
Labor Participation
Family Structure
Vehicle Availability
Education Level
Disability

Professional Degree Comparison

Immigrants from Honduras

Estonians

Tragic
Exceptional
3.5%
PROFESSIONAL DEGREE
0.3/ 100
METRIC RATING
293rd/ 347
METRIC RANK
6.0%
PROFESSIONAL DEGREE
100.0/ 100
METRIC RATING
42nd/ 347
METRIC RANK

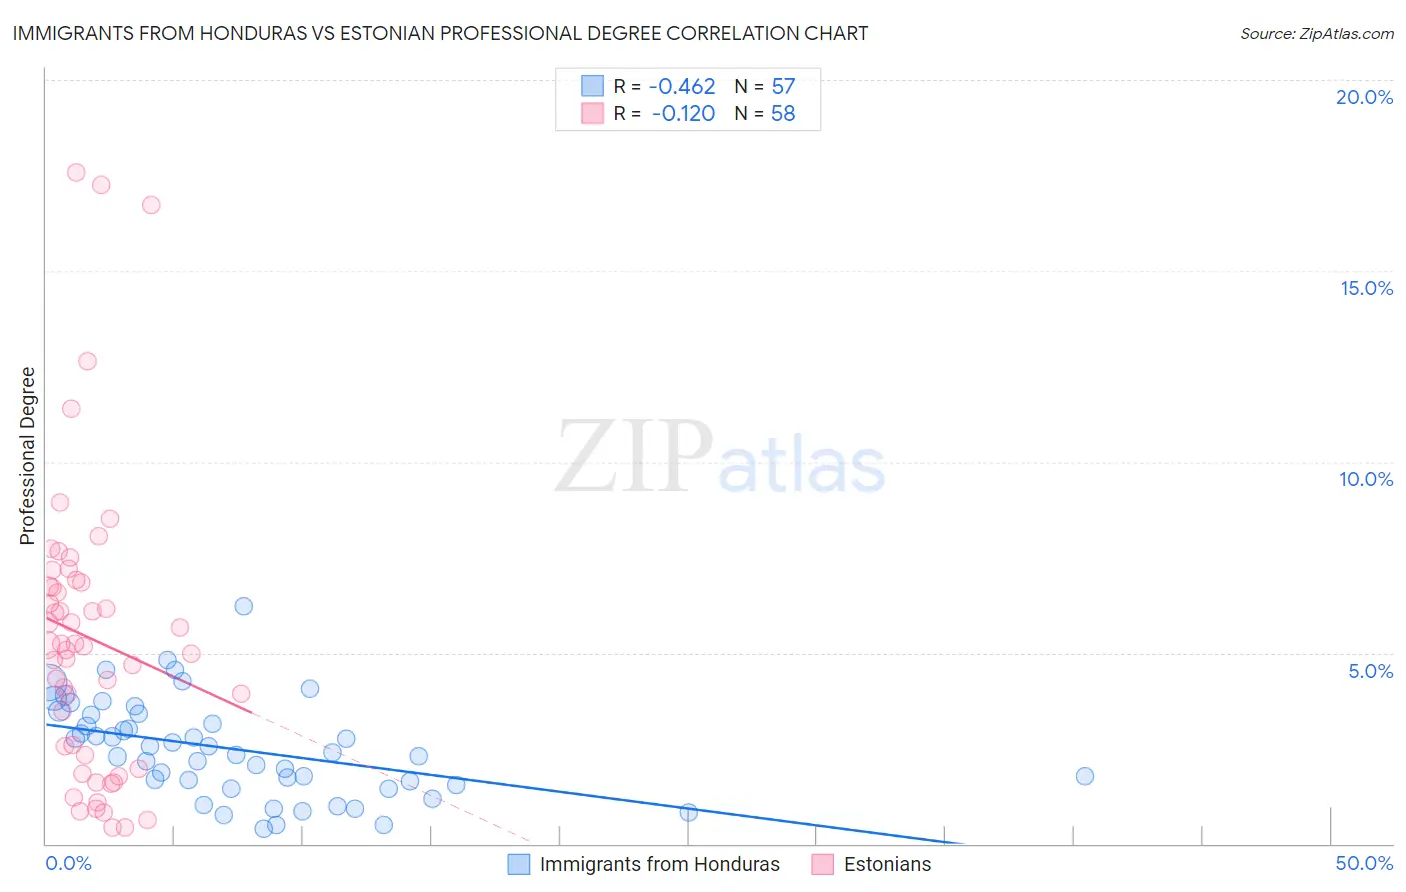
Immigrants from Honduras vs Estonian Professional Degree Correlation Chart

The statistical analysis conducted on geographies consisting of 321,705,777 people shows a moderate negative correlation between the proportion of Immigrants from Honduras and percentage of population with at least professional degree education in the United States with a correlation coefficient (R) of -0.462 and weighted average of 3.5%. Similarly, the statistical analysis conducted on geographies consisting of 123,468,720 people shows a poor negative correlation between the proportion of Estonians and percentage of population with at least professional degree education in the United States with a correlation coefficient (R) of -0.120 and weighted average of 6.0%, a difference of 72.5%.
Immigrants from Honduras vs Estonian Professional Degree

Professional Degree Correlation Summary

MeasurementImmigrants from HondurasEstonian
Minimum0.38%0.42%
Maximum6.2%17.6%
Range5.8%17.2%
Mean2.5%5.4%
Median2.4%5.2%
Interquartile 25% (IQ1)1.6%2.3%
Interquartile 75% (IQ3)3.4%6.8%
Interquartile Range (IQR)1.8%4.5%
Standard Deviation (Sample)1.3%3.9%
Standard Deviation (Population)1.2%3.8%

Similar Demographics by Professional Degree

Demographics Similar to Immigrants from Honduras by Professional Degree

In terms of professional degree, the demographic groups most similar to Immigrants from Honduras are Paiute (3.4%, a difference of 0.080%), Immigrants from Belize (3.5%, a difference of 0.24%), Immigrants from Guatemala (3.4%, a difference of 0.24%), Hawaiian (3.4%, a difference of 0.25%), and Alaska Native (3.5%, a difference of 0.30%).
DemographicsRating | RankProfessional Degree
Haitians
0.3
/100
|
#286
Tragic
3.5%
Immigrants | El Salvador
0.3
/100
|
#287
Tragic
3.5%
Blackfeet
0.3
/100
|
#288
Tragic
3.5%
Guatemalans
0.3
/100
|
#289
Tragic
3.5%
Chippewa
0.3
/100
|
#290
Tragic
3.5%
Alaska Natives
0.3
/100
|
#291
Tragic
3.5%
Immigrants | Belize
0.3
/100
|
#292
Tragic
3.5%
Immigrants | Honduras
0.3
/100
|
#293
Tragic
3.5%
Paiute
0.3
/100
|
#294
Tragic
3.4%
Immigrants | Guatemala
0.2
/100
|
#295
Tragic
3.4%
Hawaiians
0.2
/100
|
#296
Tragic
3.4%
Immigrants | Liberia
0.2
/100
|
#297
Tragic
3.4%
Ottawa
0.2
/100
|
#298
Tragic
3.4%
Immigrants | Yemen
0.2
/100
|
#299
Tragic
3.4%
Blacks/African Americans
0.2
/100
|
#300
Tragic
3.4%

Demographics Similar to Estonians by Professional Degree

In terms of professional degree, the demographic groups most similar to Estonians are New Zealander (6.0%, a difference of 0.010%), Cambodian (6.0%, a difference of 0.19%), Immigrants from Saudi Arabia (5.9%, a difference of 0.32%), Argentinean (5.9%, a difference of 0.48%), and Immigrants from South Africa (6.0%, a difference of 0.67%).
DemographicsRating | RankProfessional Degree
Immigrants | Korea
100.0
/100
|
#35
Exceptional
6.1%
Immigrants | Russia
100.0
/100
|
#36
Exceptional
6.0%
Immigrants | Austria
100.0
/100
|
#37
Exceptional
6.0%
Immigrants | Norway
100.0
/100
|
#38
Exceptional
6.0%
Immigrants | South Africa
100.0
/100
|
#39
Exceptional
6.0%
Cambodians
100.0
/100
|
#40
Exceptional
6.0%
New Zealanders
100.0
/100
|
#41
Exceptional
6.0%
Estonians
100.0
/100
|
#42
Exceptional
6.0%
Immigrants | Saudi Arabia
100.0
/100
|
#43
Exceptional
5.9%
Argentineans
100.0
/100
|
#44
Exceptional
5.9%
Immigrants | South Central Asia
100.0
/100
|
#45
Exceptional
5.9%
Immigrants | Argentina
100.0
/100
|
#46
Exceptional
5.9%
Australians
100.0
/100
|
#47
Exceptional
5.9%
Paraguayans
100.0
/100
|
#48
Exceptional
5.9%
Immigrants | Latvia
100.0
/100
|
#49
Exceptional
5.8%