Immigrants from Haiti vs Bolivian Bachelor's Degree
COMPARE
Immigrants from Haiti
Bolivian
Bachelor's Degree
Bachelor's Degree Comparison
Immigrants from Haiti
Bolivians
30.6%
BACHELOR'S DEGREE
0.0/ 100
METRIC RATING
297th/ 347
METRIC RANK
44.6%
BACHELOR'S DEGREE
99.9/ 100
METRIC RATING
47th/ 347
METRIC RANK
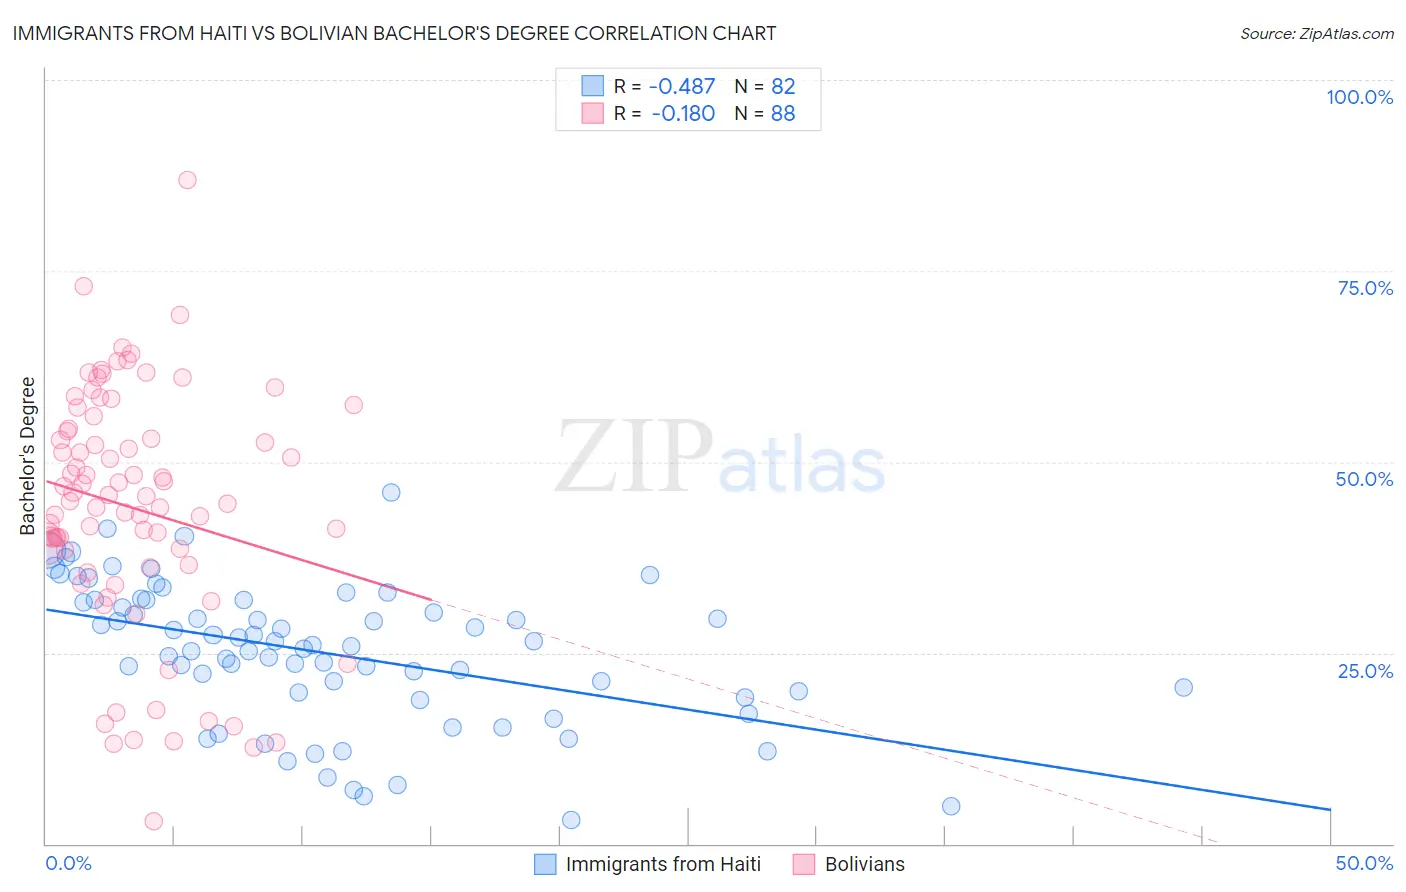
Immigrants from Haiti vs Bolivian Bachelor's Degree Correlation Chart
The statistical analysis conducted on geographies consisting of 225,272,014 people shows a moderate negative correlation between the proportion of Immigrants from Haiti and percentage of population with at least bachelor's degree education in the United States with a correlation coefficient (R) of -0.487 and weighted average of 30.6%. Similarly, the statistical analysis conducted on geographies consisting of 184,660,995 people shows a poor negative correlation between the proportion of Bolivians and percentage of population with at least bachelor's degree education in the United States with a correlation coefficient (R) of -0.180 and weighted average of 44.6%, a difference of 45.5%.
Bachelor's Degree Correlation Summary
| Measurement | Immigrants from Haiti | Bolivian |
| Minimum | 3.0% | 2.9% |
| Maximum | 46.1% | 86.9% |
| Range | 43.0% | 83.9% |
| Mean | 25.0% | 44.0% |
| Median | 25.9% | 45.2% |
| Interquartile 25% (IQ1) | 19.8% | 37.5% |
| Interquartile 75% (IQ3) | 31.9% | 54.2% |
| Interquartile Range (IQR) | 12.1% | 16.7% |
| Standard Deviation (Sample) | 9.2% | 15.8% |
| Standard Deviation (Population) | 9.2% | 15.7% |
Similar Demographics by Bachelor's Degree
Demographics Similar to Immigrants from Haiti by Bachelor's Degree
In terms of bachelor's degree, the demographic groups most similar to Immigrants from Haiti are Puget Sound Salish (30.7%, a difference of 0.060%), Immigrants from Dominican Republic (30.7%, a difference of 0.16%), Chippewa (30.6%, a difference of 0.25%), Immigrants from Guatemala (30.8%, a difference of 0.40%), and Chickasaw (30.4%, a difference of 0.77%).
| Demographics | Rating | Rank | Bachelor's Degree |
| Immigrants | Honduras | 0.1 /100 | #290 | Tragic 30.9% |
| Blacks/African Americans | 0.1 /100 | #291 | Tragic 30.9% |
| Ute | 0.1 /100 | #292 | Tragic 30.9% |
| Cape Verdeans | 0.1 /100 | #293 | Tragic 30.9% |
| Immigrants | Guatemala | 0.0 /100 | #294 | Tragic 30.8% |
| Immigrants | Dominican Republic | 0.0 /100 | #295 | Tragic 30.7% |
| Puget Sound Salish | 0.0 /100 | #296 | Tragic 30.7% |
| Immigrants | Haiti | 0.0 /100 | #297 | Tragic 30.6% |
| Chippewa | 0.0 /100 | #298 | Tragic 30.6% |
| Chickasaw | 0.0 /100 | #299 | Tragic 30.4% |
| Immigrants | Micronesia | 0.0 /100 | #300 | Tragic 30.4% |
| Immigrants | Cuba | 0.0 /100 | #301 | Tragic 30.3% |
| Mexican American Indians | 0.0 /100 | #302 | Tragic 30.2% |
| Bangladeshis | 0.0 /100 | #303 | Tragic 30.2% |
| Cherokee | 0.0 /100 | #304 | Tragic 30.2% |
Demographics Similar to Bolivians by Bachelor's Degree
In terms of bachelor's degree, the demographic groups most similar to Bolivians are Estonian (44.6%, a difference of 0.0%), Immigrants from Bulgaria (44.6%, a difference of 0.040%), Immigrants from Kuwait (44.6%, a difference of 0.090%), Immigrants from Lithuania (44.6%, a difference of 0.12%), and Immigrants from Norway (44.5%, a difference of 0.12%).
| Demographics | Rating | Rank | Bachelor's Degree |
| Immigrants | Belarus | 100.0 /100 | #40 | Exceptional 45.0% |
| Immigrants | Malaysia | 100.0 /100 | #41 | Exceptional 45.0% |
| Immigrants | Saudi Arabia | 100.0 /100 | #42 | Exceptional 44.8% |
| Immigrants | South Africa | 99.9 /100 | #43 | Exceptional 44.8% |
| Immigrants | Lithuania | 99.9 /100 | #44 | Exceptional 44.6% |
| Immigrants | Kuwait | 99.9 /100 | #45 | Exceptional 44.6% |
| Immigrants | Bulgaria | 99.9 /100 | #46 | Exceptional 44.6% |
| Bolivians | 99.9 /100 | #47 | Exceptional 44.6% |
| Estonians | 99.9 /100 | #48 | Exceptional 44.6% |
| Immigrants | Norway | 99.9 /100 | #49 | Exceptional 44.5% |
| Immigrants | Greece | 99.9 /100 | #50 | Exceptional 44.5% |
| Asians | 99.9 /100 | #51 | Exceptional 44.4% |
| Immigrants | Spain | 99.9 /100 | #52 | Exceptional 44.3% |
| Immigrants | Asia | 99.9 /100 | #53 | Exceptional 44.3% |
| Immigrants | Austria | 99.9 /100 | #54 | Exceptional 44.2% |