Immigrants from Guyana vs White/Caucasian 8th Grade

COMPARE

Immigrants from Guyana
Race
Ancestry
AfghanAfricanAlaska NativeAlaskan AthabascanAlbanianAleutAlsatianAmericanApacheArabArapahoArgentineanArmenianAssyrian/Chaldean/SyriacAustralianAustrianBahamianBangladeshiBarbadianBasqueBelgianBelizeanBermudanBhutaneseBlackfeetBolivianBrazilianBritishBritish West IndianBulgarianBurmeseCajunCambodianCanadianCape VerdeanCarpatho RusynCelticCentral AmericanCentral American IndianCherokeeCheyenneChickasawChileanChineseChippewaChoctawColombianColvilleComancheCosta RicanCreeCreekCroatianCrowCubanCypriotCzechCzechoslovakianDanishDelawareDominicanDutchDutch West IndianEastern EuropeanEcuadorianEgyptianEnglishEstonianEthiopianEuropeanFijianFilipinoFinnishFrenchFrench American IndianFrench CanadianGermanGerman RussianGhanaianGreekGuamanian/ChamorroGuatemalanGuyaneseHaitianHmongHonduranHopiHoumaHungarianIcelanderIndian (Asian)IndonesianInupiatIranianIraqiIrishIroquoisIsraeliItalianJamaicanJapaneseJordanianKenyanKiowaKoreanLaotianLatvianLebaneseLiberianLithuanianLumbeeLuxembourgerMacedonianMalaysianMalteseMarshalleseMenomineeMexicanMexican American IndianMongolianMoroccanNative HawaiianNavajoNepaleseNew ZealanderNicaraguanNigerianNorthern EuropeanNorwegianOkinawanOsageOttawaPaiutePakistaniPalestinianPanamanianParaguayanPennsylvania GermanPeruvianPimaPolishPortuguesePotawatomiPuebloPuerto RicanPuget Sound SalishRomanianRussianSalvadoranSamoanScandinavianScotch-IrishScottishSeminoleSenegaleseSerbianShoshoneSierra LeoneanSiouxSlavicSlovakSloveneSomaliSouth AfricanSouth AmericanSouth American IndianSoviet UnionSpaniardSpanishSpanish AmericanSpanish American IndianSri LankanSubsaharan AfricanSudaneseSwedishSwissSyrianTaiwaneseThaiTlingit-HaidaTohono O'OdhamTonganTrinidadian and TobagonianTsimshianTurkishU.S. Virgin IslanderUgandanUkrainianUruguayanUteVenezuelanVietnameseWelshWest IndianYakamaYaquiYugoslavianYumanYup'ikZimbabwean
Immigration
NonimmigrantsImmigrantsAfghanistanAfricaAlbaniaArgentinaArmeniaAsiaAustraliaAustriaBahamasBangladeshBarbadosBelarusBelgiumBelizeBoliviaBosnia and HerzegovinaBrazilBulgariaBurma/MyanmarCabo VerdeCambodiaCameroonCanadaCaribbeanCentral AmericaChileChinaColombiaCongoCosta RicaCroatiaCubaCzechoslovakiaDenmarkDominicaDominican RepublicEastern AfricaEastern AsiaEastern EuropeEcuadorEgyptEl SalvadorEnglandEritreaEthiopiaEuropeFijiFranceGermanyGhanaGreeceGrenadaGuatemalaGuyanaHaitiHondurasHong KongHungaryIndiaIndonesiaIranIraqIrelandIsraelItalyJamaicaJapanJordanKazakhstanKenyaKoreaKuwaitLaosLatin AmericaLatviaLebanonLiberiaLithuaniaMalaysiaMexicoMicronesiaMiddle AfricaMoldovaMoroccoNepalNetherlandsNicaraguaNigeriaNorth AmericaNorth MacedoniaNorthern AfricaNorthern EuropeNorwayOceaniaPakistanPanamaPeruPhilippinesPolandPortugalRomaniaRussiaSaudi ArabiaScotlandSenegalSerbiaSierra LeoneSingaporeSomaliaSouth AfricaSouth AmericaSouth Central AsiaSouth Eastern AsiaSouthern EuropeSpainSri LankaSt. Vincent and the GrenadinesSudanSwedenSwitzerlandSyriaTaiwanThailandTrinidad and TobagoTurkeyUgandaUkraineUruguayUzbekistanVenezuelaVietnamWest IndiesWestern AfricaWestern AsiaWestern EuropeYemenZaireZimbabweAzores
White/Caucasian
Race
Ancestry
AfghanAfricanAlaska NativeAlaskan AthabascanAlbanianAleutAlsatianAmericanApacheArabArapahoArgentineanArmenianAssyrian/Chaldean/SyriacAustralianAustrianBahamianBangladeshiBarbadianBasqueBelgianBelizeanBermudanBhutaneseBlackfeetBolivianBrazilianBritishBritish West IndianBulgarianBurmeseCajunCambodianCanadianCape VerdeanCarpatho RusynCelticCentral AmericanCentral American IndianCherokeeCheyenneChickasawChileanChineseChippewaChoctawColombianColvilleComancheCosta RicanCreeCreekCroatianCrowCubanCypriotCzechCzechoslovakianDanishDelawareDominicanDutchDutch West IndianEastern EuropeanEcuadorianEgyptianEnglishEstonianEthiopianEuropeanFijianFilipinoFinnishFrenchFrench American IndianFrench CanadianGermanGerman RussianGhanaianGreekGuamanian/ChamorroGuatemalanGuyaneseHaitianHmongHonduranHopiHoumaHungarianIcelanderIndian (Asian)IndonesianInupiatIranianIraqiIrishIroquoisIsraeliItalianJamaicanJapaneseJordanianKenyanKiowaKoreanLaotianLatvianLebaneseLiberianLithuanianLumbeeLuxembourgerMacedonianMalaysianMalteseMarshalleseMenomineeMexicanMexican American IndianMongolianMoroccanNative HawaiianNavajoNepaleseNew ZealanderNicaraguanNigerianNorthern EuropeanNorwegianOkinawanOsageOttawaPaiutePakistaniPalestinianPanamanianParaguayanPennsylvania GermanPeruvianPimaPolishPortuguesePotawatomiPuebloPuerto RicanPuget Sound SalishRomanianRussianSalvadoranSamoanScandinavianScotch-IrishScottishSeminoleSenegaleseSerbianShoshoneSierra LeoneanSiouxSlavicSlovakSloveneSomaliSouth AfricanSouth AmericanSouth American IndianSoviet UnionSpaniardSpanishSpanish AmericanSpanish American IndianSri LankanSubsaharan AfricanSudaneseSwedishSwissSyrianTaiwaneseThaiTlingit-HaidaTohono O'OdhamTonganTrinidadian and TobagonianTsimshianTurkishU.S. Virgin IslanderUgandanUkrainianUruguayanUteVenezuelanVietnameseWelshWest IndianYakamaYaquiYugoslavianYumanYup'ikZimbabwean
Immigration
NonimmigrantsImmigrantsAfghanistanAfricaAlbaniaArgentinaArmeniaAsiaAustraliaAustriaBahamasBangladeshBarbadosBelarusBelgiumBelizeBoliviaBosnia and HerzegovinaBrazilBulgariaBurma/MyanmarCabo VerdeCambodiaCameroonCanadaCaribbeanCentral AmericaChileChinaColombiaCongoCosta RicaCroatiaCubaCzechoslovakiaDenmarkDominicaDominican RepublicEastern AfricaEastern AsiaEastern EuropeEcuadorEgyptEl SalvadorEnglandEritreaEthiopiaEuropeFijiFranceGermanyGhanaGreeceGrenadaGuatemalaHaitiHondurasHong KongHungaryIndiaIndonesiaIranIraqIrelandIsraelItalyJamaicaJapanJordanKazakhstanKenyaKoreaKuwaitLaosLatin AmericaLatviaLebanonLiberiaLithuaniaMalaysiaMexicoMicronesiaMiddle AfricaMoldovaMoroccoNepalNetherlandsNicaraguaNigeriaNorth AmericaNorth MacedoniaNorthern AfricaNorthern EuropeNorwayOceaniaPakistanPanamaPeruPhilippinesPolandPortugalRomaniaRussiaSaudi ArabiaScotlandSenegalSerbiaSierra LeoneSingaporeSomaliaSouth AfricaSouth AmericaSouth Central AsiaSouth Eastern AsiaSouthern EuropeSpainSri LankaSt. Vincent and the GrenadinesSudanSwedenSwitzerlandSyriaTaiwanThailandTrinidad and TobagoTurkeyUgandaUkraineUruguayUzbekistanVenezuelaVietnamWest IndiesWestern AfricaWestern AsiaWestern EuropeYemenZaireZimbabweAzores
8th Grade
Income
Poverty
Unemployment
Labor Participation
Family Structure
Vehicle Availability
Education Level
Disability

8th Grade Comparison

Immigrants from Guyana

Whites/Caucasians

Tragic
Exceptional
93.8%
8TH GRADE
0.0/ 100
METRIC RATING
306th/ 347
METRIC RANK
96.7%
8TH GRADE
99.8/ 100
METRIC RATING
62nd/ 347
METRIC RANK

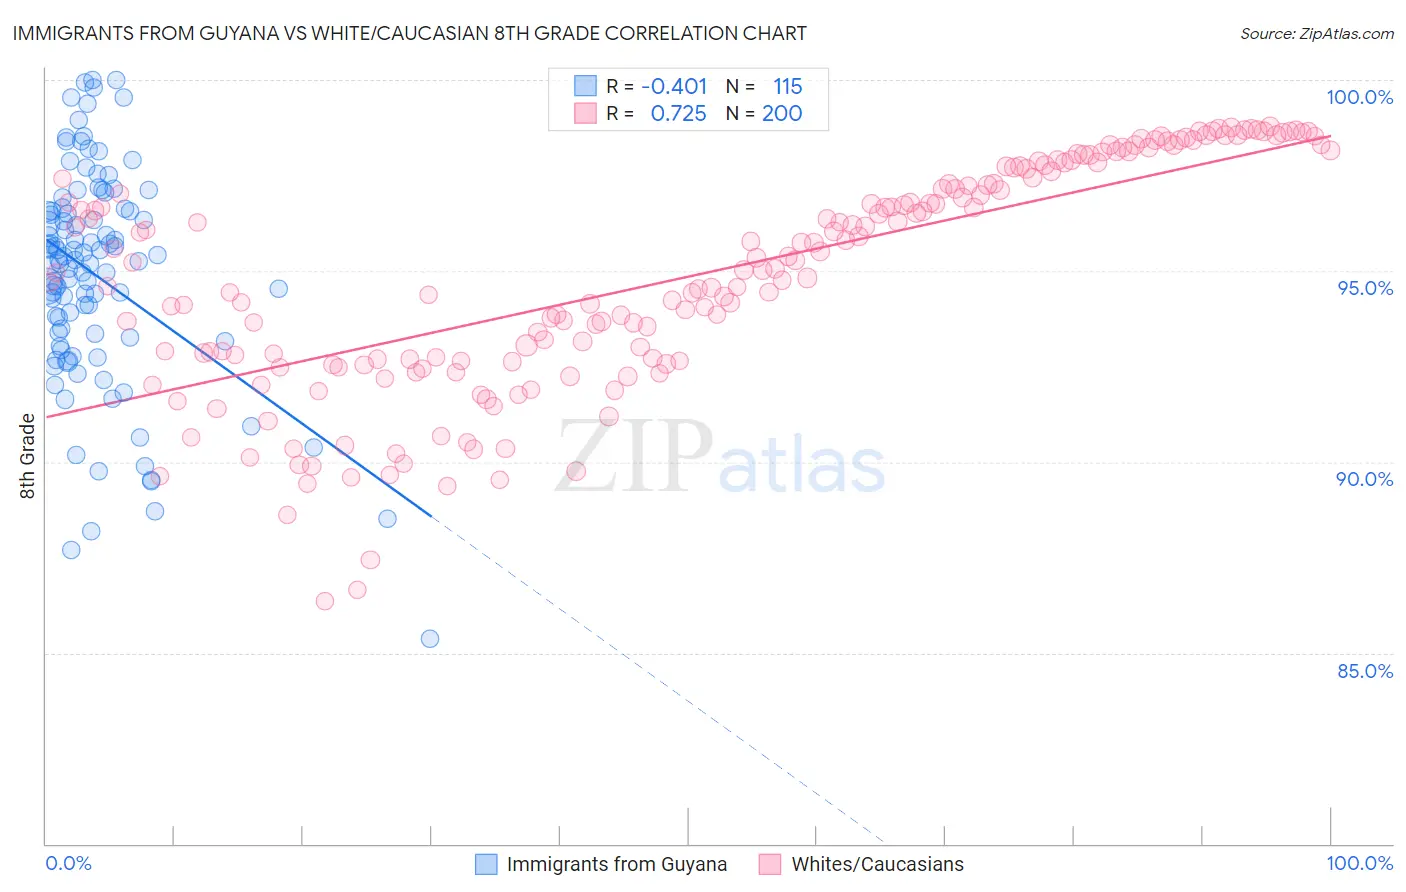
Immigrants from Guyana vs White/Caucasian 8th Grade Correlation Chart

The statistical analysis conducted on geographies consisting of 183,673,461 people shows a moderate negative correlation between the proportion of Immigrants from Guyana and percentage of population with at least 8th grade education in the United States with a correlation coefficient (R) of -0.401 and weighted average of 93.8%. Similarly, the statistical analysis conducted on geographies consisting of 585,246,768 people shows a strong positive correlation between the proportion of Whites/Caucasians and percentage of population with at least 8th grade education in the United States with a correlation coefficient (R) of 0.725 and weighted average of 96.7%, a difference of 3.1%.
Immigrants from Guyana vs White/Caucasian 8th Grade

8th Grade Correlation Summary

MeasurementImmigrants from GuyanaWhite/Caucasian
Minimum85.4%86.3%
Maximum100.0%98.8%
Range14.6%12.4%
Mean94.9%94.9%
Median95.3%95.0%
Interquartile 25% (IQ1)93.3%92.6%
Interquartile 75% (IQ3)96.6%97.5%
Interquartile Range (IQR)3.3%4.9%
Standard Deviation (Sample)2.9%2.9%
Standard Deviation (Population)2.8%2.9%

Similar Demographics by 8th Grade

Demographics Similar to Immigrants from Guyana by 8th Grade

In terms of 8th grade, the demographic groups most similar to Immigrants from Guyana are Immigrants from Portugal (93.8%, a difference of 0.010%), Immigrants from Haiti (93.9%, a difference of 0.090%), Guyanese (93.9%, a difference of 0.13%), Ecuadorian (93.6%, a difference of 0.18%), and Immigrants (93.6%, a difference of 0.20%).
DemographicsRating | Rank8th Grade
Cubans
0.0
/100
|
#299
Tragic
94.1%
Immigrants | Burma/Myanmar
0.0
/100
|
#300
Tragic
94.1%
Immigrants | Laos
0.0
/100
|
#301
Tragic
94.1%
Sri Lankans
0.0
/100
|
#302
Tragic
94.0%
Immigrants | Dominica
0.0
/100
|
#303
Tragic
94.0%
Guyanese
0.0
/100
|
#304
Tragic
93.9%
Immigrants | Haiti
0.0
/100
|
#305
Tragic
93.9%
Immigrants | Guyana
0.0
/100
|
#306
Tragic
93.8%
Immigrants | Portugal
0.0
/100
|
#307
Tragic
93.8%
Ecuadorians
0.0
/100
|
#308
Tragic
93.6%
Immigrants | Immigrants
0.0
/100
|
#309
Tragic
93.6%
Japanese
0.0
/100
|
#310
Tragic
93.6%
Immigrants | Bangladesh
0.0
/100
|
#311
Tragic
93.6%
Cape Verdeans
0.0
/100
|
#312
Tragic
93.5%
Immigrants | Caribbean
0.0
/100
|
#313
Tragic
93.5%

Demographics Similar to Whites/Caucasians by 8th Grade

In terms of 8th grade, the demographic groups most similar to Whites/Caucasians are Immigrants from Austria (96.7%, a difference of 0.010%), Immigrants from North America (96.7%, a difference of 0.020%), Immigrants from Northern Europe (96.7%, a difference of 0.020%), Ukrainian (96.7%, a difference of 0.020%), and Immigrants from India (96.6%, a difference of 0.020%).
DemographicsRating | Rank8th Grade
Russians
99.8
/100
|
#55
Exceptional
96.7%
Australians
99.8
/100
|
#56
Exceptional
96.7%
Macedonians
99.8
/100
|
#57
Exceptional
96.7%
Immigrants | Canada
99.8
/100
|
#58
Exceptional
96.7%
Immigrants | North America
99.8
/100
|
#59
Exceptional
96.7%
Immigrants | Northern Europe
99.8
/100
|
#60
Exceptional
96.7%
Immigrants | Austria
99.8
/100
|
#61
Exceptional
96.7%
Whites/Caucasians
99.8
/100
|
#62
Exceptional
96.7%
Ukrainians
99.7
/100
|
#63
Exceptional
96.7%
Immigrants | India
99.7
/100
|
#64
Exceptional
96.6%
Native Hawaiians
99.7
/100
|
#65
Exceptional
96.6%
Canadians
99.7
/100
|
#66
Exceptional
96.6%
Iranians
99.7
/100
|
#67
Exceptional
96.6%
Creek
99.7
/100
|
#68
Exceptional
96.6%
Americans
99.7
/100
|
#69
Exceptional
96.6%