Immigrants from Guyana vs Immigrants from Sri Lanka Doctorate Degree

COMPARE

Immigrants from Guyana
Race
Ancestry
AfghanAfricanAlaska NativeAlaskan AthabascanAlbanianAleutAlsatianAmericanApacheArabArapahoArgentineanArmenianAssyrian/Chaldean/SyriacAustralianAustrianBahamianBangladeshiBarbadianBasqueBelgianBelizeanBermudanBhutaneseBlackfeetBolivianBrazilianBritishBritish West IndianBulgarianBurmeseCajunCambodianCanadianCape VerdeanCarpatho RusynCelticCentral AmericanCentral American IndianCherokeeCheyenneChickasawChileanChineseChippewaChoctawColombianColvilleComancheCosta RicanCreeCreekCroatianCrowCubanCypriotCzechCzechoslovakianDanishDelawareDominicanDutchDutch West IndianEastern EuropeanEcuadorianEgyptianEnglishEstonianEthiopianEuropeanFijianFilipinoFinnishFrenchFrench American IndianFrench CanadianGermanGerman RussianGhanaianGreekGuamanian/ChamorroGuatemalanGuyaneseHaitianHmongHonduranHopiHoumaHungarianIcelanderIndian (Asian)IndonesianInupiatIranianIraqiIrishIroquoisIsraeliItalianJamaicanJapaneseJordanianKenyanKiowaKoreanLaotianLatvianLebaneseLiberianLithuanianLumbeeLuxembourgerMacedonianMalaysianMalteseMarshalleseMenomineeMexicanMexican American IndianMongolianMoroccanNative HawaiianNavajoNepaleseNew ZealanderNicaraguanNigerianNorthern EuropeanNorwegianOkinawanOsageOttawaPaiutePakistaniPalestinianPanamanianParaguayanPennsylvania GermanPeruvianPimaPolishPortuguesePotawatomiPuebloPuerto RicanPuget Sound SalishRomanianRussianSalvadoranSamoanScandinavianScotch-IrishScottishSeminoleSenegaleseSerbianShoshoneSierra LeoneanSiouxSlavicSlovakSloveneSomaliSouth AfricanSouth AmericanSouth American IndianSoviet UnionSpaniardSpanishSpanish AmericanSpanish American IndianSri LankanSubsaharan AfricanSudaneseSwedishSwissSyrianTaiwaneseThaiTlingit-HaidaTohono O'OdhamTonganTrinidadian and TobagonianTsimshianTurkishU.S. Virgin IslanderUgandanUkrainianUruguayanUteVenezuelanVietnameseWelshWest IndianYakamaYaquiYugoslavianYumanYup'ikZimbabwean
Immigration
NonimmigrantsImmigrantsAfghanistanAfricaAlbaniaArgentinaArmeniaAsiaAustraliaAustriaBahamasBangladeshBarbadosBelarusBelgiumBelizeBoliviaBosnia and HerzegovinaBrazilBulgariaBurma/MyanmarCabo VerdeCambodiaCameroonCanadaCaribbeanCentral AmericaChileChinaColombiaCongoCosta RicaCroatiaCubaCzechoslovakiaDenmarkDominicaDominican RepublicEastern AfricaEastern AsiaEastern EuropeEcuadorEgyptEl SalvadorEnglandEritreaEthiopiaEuropeFijiFranceGermanyGhanaGreeceGrenadaGuatemalaGuyanaHaitiHondurasHong KongHungaryIndiaIndonesiaIranIraqIrelandIsraelItalyJamaicaJapanJordanKazakhstanKenyaKoreaKuwaitLaosLatin AmericaLatviaLebanonLiberiaLithuaniaMalaysiaMexicoMicronesiaMiddle AfricaMoldovaMoroccoNepalNetherlandsNicaraguaNigeriaNorth AmericaNorth MacedoniaNorthern AfricaNorthern EuropeNorwayOceaniaPakistanPanamaPeruPhilippinesPolandPortugalRomaniaRussiaSaudi ArabiaScotlandSenegalSerbiaSierra LeoneSingaporeSomaliaSouth AfricaSouth AmericaSouth Central AsiaSouth Eastern AsiaSouthern EuropeSpainSt. Vincent and the GrenadinesSudanSwedenSwitzerlandSyriaTaiwanThailandTrinidad and TobagoTurkeyUgandaUkraineUruguayUzbekistanVenezuelaVietnamWest IndiesWestern AfricaWestern AsiaWestern EuropeYemenZaireZimbabweAzores
Immigrants from Sri Lanka
Race
Ancestry
AfghanAfricanAlaska NativeAlaskan AthabascanAlbanianAleutAlsatianAmericanApacheArabArapahoArgentineanArmenianAssyrian/Chaldean/SyriacAustralianAustrianBahamianBangladeshiBarbadianBasqueBelgianBelizeanBermudanBhutaneseBlackfeetBolivianBrazilianBritishBritish West IndianBulgarianBurmeseCajunCambodianCanadianCape VerdeanCarpatho RusynCelticCentral AmericanCentral American IndianCherokeeCheyenneChickasawChileanChineseChippewaChoctawColombianColvilleComancheCosta RicanCreeCreekCroatianCrowCubanCypriotCzechCzechoslovakianDanishDelawareDominicanDutchDutch West IndianEastern EuropeanEcuadorianEgyptianEnglishEstonianEthiopianEuropeanFijianFilipinoFinnishFrenchFrench American IndianFrench CanadianGermanGerman RussianGhanaianGreekGuamanian/ChamorroGuatemalanGuyaneseHaitianHmongHonduranHopiHoumaHungarianIcelanderIndian (Asian)IndonesianInupiatIranianIraqiIrishIroquoisIsraeliItalianJamaicanJapaneseJordanianKenyanKiowaKoreanLaotianLatvianLebaneseLiberianLithuanianLumbeeLuxembourgerMacedonianMalaysianMalteseMarshalleseMenomineeMexicanMexican American IndianMongolianMoroccanNative HawaiianNavajoNepaleseNew ZealanderNicaraguanNigerianNorthern EuropeanNorwegianOkinawanOsageOttawaPaiutePakistaniPalestinianPanamanianParaguayanPennsylvania GermanPeruvianPimaPolishPortuguesePotawatomiPuebloPuerto RicanPuget Sound SalishRomanianRussianSalvadoranSamoanScandinavianScotch-IrishScottishSeminoleSenegaleseSerbianShoshoneSierra LeoneanSiouxSlavicSlovakSloveneSomaliSouth AfricanSouth AmericanSouth American IndianSoviet UnionSpaniardSpanishSpanish AmericanSpanish American IndianSri LankanSubsaharan AfricanSudaneseSwedishSwissSyrianTaiwaneseThaiTlingit-HaidaTohono O'OdhamTonganTrinidadian and TobagonianTsimshianTurkishU.S. Virgin IslanderUgandanUkrainianUruguayanUteVenezuelanVietnameseWelshWest IndianYakamaYaquiYugoslavianYumanYup'ikZimbabwean
Immigration
NonimmigrantsImmigrantsAfghanistanAfricaAlbaniaArgentinaArmeniaAsiaAustraliaAustriaBahamasBangladeshBarbadosBelarusBelgiumBelizeBoliviaBosnia and HerzegovinaBrazilBulgariaBurma/MyanmarCabo VerdeCambodiaCameroonCanadaCaribbeanCentral AmericaChileChinaColombiaCongoCosta RicaCroatiaCubaCzechoslovakiaDenmarkDominicaDominican RepublicEastern AfricaEastern AsiaEastern EuropeEcuadorEgyptEl SalvadorEnglandEritreaEthiopiaEuropeFijiFranceGermanyGhanaGreeceGrenadaGuatemalaHaitiHondurasHong KongHungaryIndiaIndonesiaIranIraqIrelandIsraelItalyJamaicaJapanJordanKazakhstanKenyaKoreaKuwaitLaosLatin AmericaLatviaLebanonLiberiaLithuaniaMalaysiaMexicoMicronesiaMiddle AfricaMoldovaMoroccoNepalNetherlandsNicaraguaNigeriaNorth AmericaNorth MacedoniaNorthern AfricaNorthern EuropeNorwayOceaniaPakistanPanamaPeruPhilippinesPolandPortugalRomaniaRussiaSaudi ArabiaScotlandSenegalSerbiaSierra LeoneSingaporeSomaliaSouth AfricaSouth AmericaSouth Central AsiaSouth Eastern AsiaSouthern EuropeSpainSri LankaSt. Vincent and the GrenadinesSudanSwedenSwitzerlandSyriaTaiwanThailandTrinidad and TobagoTurkeyUgandaUkraineUruguayUzbekistanVenezuelaVietnamWest IndiesWestern AfricaWestern AsiaWestern EuropeYemenZaireZimbabweAzores
Doctorate Degree
Income
Poverty
Unemployment
Labor Participation
Family Structure
Vehicle Availability
Education Level
Disability

Doctorate Degree Comparison

Immigrants from Guyana

Immigrants from Sri Lanka

Tragic
Exceptional
1.3%
DOCTORATE DEGREE
0.1/ 100
METRIC RATING
319th/ 347
METRIC RANK
2.8%
DOCTORATE DEGREE
100.0/ 100
METRIC RATING
18th/ 347
METRIC RANK

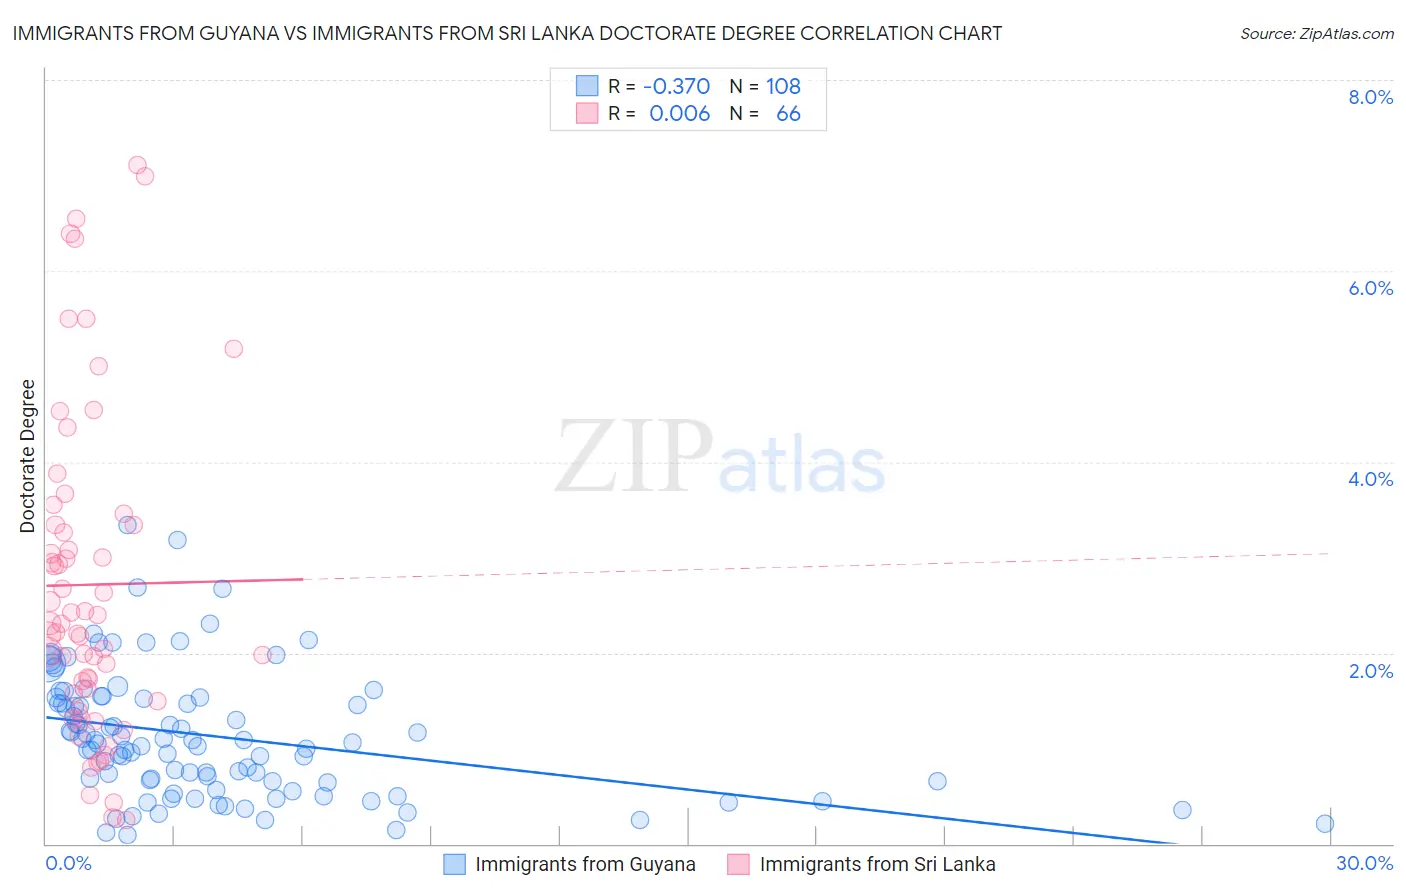
Immigrants from Guyana vs Immigrants from Sri Lanka Doctorate Degree Correlation Chart

The statistical analysis conducted on geographies consisting of 183,107,969 people shows a mild negative correlation between the proportion of Immigrants from Guyana and percentage of population with at least doctorate degree education in the United States with a correlation coefficient (R) of -0.370 and weighted average of 1.3%. Similarly, the statistical analysis conducted on geographies consisting of 149,516,324 people shows no correlation between the proportion of Immigrants from Sri Lanka and percentage of population with at least doctorate degree education in the United States with a correlation coefficient (R) of 0.006 and weighted average of 2.8%, a difference of 109.5%.
Immigrants from Guyana vs Immigrants from Sri Lanka Doctorate Degree

Doctorate Degree Correlation Summary

MeasurementImmigrants from GuyanaImmigrants from Sri Lanka
Minimum0.090%0.25%
Maximum3.3%7.1%
Range3.3%6.9%
Mean1.1%2.7%
Median1.1%2.3%
Interquartile 25% (IQ1)0.65%1.6%
Interquartile 75% (IQ3)1.5%3.3%
Interquartile Range (IQR)0.88%1.8%
Standard Deviation (Sample)0.66%1.7%
Standard Deviation (Population)0.66%1.7%

Similar Demographics by Doctorate Degree

Demographics Similar to Immigrants from Guyana by Doctorate Degree

In terms of doctorate degree, the demographic groups most similar to Immigrants from Guyana are Immigrants from St. Vincent and the Grenadines (1.3%, a difference of 0.060%), Dutch West Indian (1.3%, a difference of 0.17%), Seminole (1.3%, a difference of 0.23%), Immigrants from Belize (1.3%, a difference of 0.43%), and Native/Alaskan (1.3%, a difference of 0.75%).
DemographicsRating | RankDoctorate Degree
Immigrants | Nicaragua
0.1
/100
|
#312
Tragic
1.4%
Menominee
0.1
/100
|
#313
Tragic
1.4%
Dominicans
0.1
/100
|
#314
Tragic
1.4%
Immigrants | Azores
0.1
/100
|
#315
Tragic
1.4%
Navajo
0.1
/100
|
#316
Tragic
1.4%
Immigrants | Micronesia
0.1
/100
|
#317
Tragic
1.3%
Creek
0.1
/100
|
#318
Tragic
1.3%
Immigrants | Guyana
0.1
/100
|
#319
Tragic
1.3%
Immigrants | St. Vincent and the Grenadines
0.1
/100
|
#320
Tragic
1.3%
Dutch West Indians
0.1
/100
|
#321
Tragic
1.3%
Seminole
0.1
/100
|
#322
Tragic
1.3%
Immigrants | Belize
0.1
/100
|
#323
Tragic
1.3%
Natives/Alaskans
0.0
/100
|
#324
Tragic
1.3%
Pima
0.0
/100
|
#325
Tragic
1.3%
Immigrants | Cabo Verde
0.0
/100
|
#326
Tragic
1.3%

Demographics Similar to Immigrants from Sri Lanka by Doctorate Degree

In terms of doctorate degree, the demographic groups most similar to Immigrants from Sri Lanka are Immigrants from Australia (2.8%, a difference of 0.24%), Immigrants from Japan (2.8%, a difference of 0.37%), Immigrants from Hong Kong (2.8%, a difference of 0.73%), Eastern European (2.8%, a difference of 0.94%), and Thai (2.8%, a difference of 1.1%).
DemographicsRating | RankDoctorate Degree
Indians (Asian)
100.0
/100
|
#11
Exceptional
2.9%
Immigrants | Belgium
100.0
/100
|
#12
Exceptional
2.9%
Immigrants | Sweden
100.0
/100
|
#13
Exceptional
2.9%
Immigrants | France
100.0
/100
|
#14
Exceptional
2.9%
Immigrants | India
100.0
/100
|
#15
Exceptional
2.8%
Eastern Europeans
100.0
/100
|
#16
Exceptional
2.8%
Immigrants | Australia
100.0
/100
|
#17
Exceptional
2.8%
Immigrants | Sri Lanka
100.0
/100
|
#18
Exceptional
2.8%
Immigrants | Japan
100.0
/100
|
#19
Exceptional
2.8%
Immigrants | Hong Kong
100.0
/100
|
#20
Exceptional
2.8%
Thais
100.0
/100
|
#21
Exceptional
2.8%
Mongolians
100.0
/100
|
#22
Exceptional
2.8%
Immigrants | Denmark
100.0
/100
|
#23
Exceptional
2.8%
Israelis
100.0
/100
|
#24
Exceptional
2.7%
Immigrants | Saudi Arabia
100.0
/100
|
#25
Exceptional
2.7%