Immigrants from Guyana vs French 9th Grade

COMPARE

Immigrants from Guyana
Race
Ancestry
AfghanAfricanAlaska NativeAlaskan AthabascanAlbanianAleutAlsatianAmericanApacheArabArapahoArgentineanArmenianAssyrian/Chaldean/SyriacAustralianAustrianBahamianBangladeshiBarbadianBasqueBelgianBelizeanBermudanBhutaneseBlackfeetBolivianBrazilianBritishBritish West IndianBulgarianBurmeseCajunCambodianCanadianCape VerdeanCarpatho RusynCelticCentral AmericanCentral American IndianCherokeeCheyenneChickasawChileanChineseChippewaChoctawColombianColvilleComancheCosta RicanCreeCreekCroatianCrowCubanCypriotCzechCzechoslovakianDanishDelawareDominicanDutchDutch West IndianEastern EuropeanEcuadorianEgyptianEnglishEstonianEthiopianEuropeanFijianFilipinoFinnishFrench American IndianFrench CanadianGermanGerman RussianGhanaianGreekGuamanian/ChamorroGuatemalanGuyaneseHaitianHmongHonduranHopiHoumaHungarianIcelanderIndian (Asian)IndonesianInupiatIranianIraqiIrishIroquoisIsraeliItalianJamaicanJapaneseJordanianKenyanKiowaKoreanLaotianLatvianLebaneseLiberianLithuanianLumbeeLuxembourgerMacedonianMalaysianMalteseMarshalleseMenomineeMexicanMexican American IndianMongolianMoroccanNative HawaiianNavajoNepaleseNew ZealanderNicaraguanNigerianNorthern EuropeanNorwegianOkinawanOsageOttawaPaiutePakistaniPalestinianPanamanianParaguayanPennsylvania GermanPeruvianPimaPolishPortuguesePotawatomiPuebloPuerto RicanPuget Sound SalishRomanianRussianSalvadoranSamoanScandinavianScotch-IrishScottishSeminoleSenegaleseSerbianShoshoneSierra LeoneanSiouxSlavicSlovakSloveneSomaliSouth AfricanSouth AmericanSouth American IndianSoviet UnionSpaniardSpanishSpanish AmericanSpanish American IndianSri LankanSubsaharan AfricanSudaneseSwedishSwissSyrianTaiwaneseThaiTlingit-HaidaTohono O'OdhamTonganTrinidadian and TobagonianTsimshianTurkishU.S. Virgin IslanderUgandanUkrainianUruguayanUteVenezuelanVietnameseWelshWest IndianYakamaYaquiYugoslavianYumanYup'ikZimbabwean
Immigration
NonimmigrantsImmigrantsAfghanistanAfricaAlbaniaArgentinaArmeniaAsiaAustraliaAustriaBahamasBangladeshBarbadosBelarusBelgiumBelizeBoliviaBosnia and HerzegovinaBrazilBulgariaBurma/MyanmarCabo VerdeCambodiaCameroonCanadaCaribbeanCentral AmericaChileChinaColombiaCongoCosta RicaCroatiaCubaCzechoslovakiaDenmarkDominicaDominican RepublicEastern AfricaEastern AsiaEastern EuropeEcuadorEgyptEl SalvadorEnglandEritreaEthiopiaEuropeFijiFranceGermanyGhanaGreeceGrenadaGuatemalaGuyanaHaitiHondurasHong KongHungaryIndiaIndonesiaIranIraqIrelandIsraelItalyJamaicaJapanJordanKazakhstanKenyaKoreaKuwaitLaosLatin AmericaLatviaLebanonLiberiaLithuaniaMalaysiaMexicoMicronesiaMiddle AfricaMoldovaMoroccoNepalNetherlandsNicaraguaNigeriaNorth AmericaNorth MacedoniaNorthern AfricaNorthern EuropeNorwayOceaniaPakistanPanamaPeruPhilippinesPolandPortugalRomaniaRussiaSaudi ArabiaScotlandSenegalSerbiaSierra LeoneSingaporeSomaliaSouth AfricaSouth AmericaSouth Central AsiaSouth Eastern AsiaSouthern EuropeSpainSri LankaSt. Vincent and the GrenadinesSudanSwedenSwitzerlandSyriaTaiwanThailandTrinidad and TobagoTurkeyUgandaUkraineUruguayUzbekistanVenezuelaVietnamWest IndiesWestern AfricaWestern AsiaWestern EuropeYemenZaireZimbabweAzores
French
Race
Ancestry
AfghanAfricanAlaska NativeAlaskan AthabascanAlbanianAleutAlsatianAmericanApacheArabArapahoArgentineanArmenianAssyrian/Chaldean/SyriacAustralianAustrianBahamianBangladeshiBarbadianBasqueBelgianBelizeanBermudanBhutaneseBlackfeetBolivianBrazilianBritishBritish West IndianBulgarianBurmeseCajunCambodianCanadianCape VerdeanCarpatho RusynCelticCentral AmericanCentral American IndianCherokeeCheyenneChickasawChileanChineseChippewaChoctawColombianColvilleComancheCosta RicanCreeCreekCroatianCrowCubanCypriotCzechCzechoslovakianDanishDelawareDominicanDutchDutch West IndianEastern EuropeanEcuadorianEgyptianEnglishEstonianEthiopianEuropeanFijianFilipinoFinnishFrenchFrench American IndianFrench CanadianGermanGerman RussianGhanaianGreekGuamanian/ChamorroGuatemalanGuyaneseHaitianHmongHonduranHopiHoumaHungarianIcelanderIndian (Asian)IndonesianInupiatIranianIraqiIrishIroquoisIsraeliItalianJamaicanJapaneseJordanianKenyanKiowaKoreanLaotianLatvianLebaneseLiberianLithuanianLumbeeLuxembourgerMacedonianMalaysianMalteseMarshalleseMenomineeMexicanMexican American IndianMongolianMoroccanNative HawaiianNavajoNepaleseNew ZealanderNicaraguanNigerianNorthern EuropeanNorwegianOkinawanOsageOttawaPaiutePakistaniPalestinianPanamanianParaguayanPennsylvania GermanPeruvianPimaPolishPortuguesePotawatomiPuebloPuerto RicanPuget Sound SalishRomanianRussianSalvadoranSamoanScandinavianScotch-IrishScottishSeminoleSenegaleseSerbianShoshoneSierra LeoneanSiouxSlavicSlovakSloveneSomaliSouth AfricanSouth AmericanSouth American IndianSoviet UnionSpaniardSpanishSpanish AmericanSpanish American IndianSri LankanSubsaharan AfricanSudaneseSwedishSwissSyrianTaiwaneseThaiTlingit-HaidaTohono O'OdhamTonganTrinidadian and TobagonianTsimshianTurkishU.S. Virgin IslanderUgandanUkrainianUruguayanUteVenezuelanVietnameseWelshWest IndianYakamaYaquiYugoslavianYumanYup'ikZimbabwean
Immigration
NonimmigrantsImmigrantsAfghanistanAfricaAlbaniaArgentinaArmeniaAsiaAustraliaAustriaBahamasBangladeshBarbadosBelarusBelgiumBelizeBoliviaBosnia and HerzegovinaBrazilBulgariaBurma/MyanmarCabo VerdeCambodiaCameroonCanadaCaribbeanCentral AmericaChileChinaColombiaCongoCosta RicaCroatiaCubaCzechoslovakiaDenmarkDominicaDominican RepublicEastern AfricaEastern AsiaEastern EuropeEcuadorEgyptEl SalvadorEnglandEritreaEthiopiaEuropeFijiFranceGermanyGhanaGreeceGrenadaGuatemalaHaitiHondurasHong KongHungaryIndiaIndonesiaIranIraqIrelandIsraelItalyJamaicaJapanJordanKazakhstanKenyaKoreaKuwaitLaosLatin AmericaLatviaLebanonLiberiaLithuaniaMalaysiaMexicoMicronesiaMiddle AfricaMoldovaMoroccoNepalNetherlandsNicaraguaNigeriaNorth AmericaNorth MacedoniaNorthern AfricaNorthern EuropeNorwayOceaniaPakistanPanamaPeruPhilippinesPolandPortugalRomaniaRussiaSaudi ArabiaScotlandSenegalSerbiaSierra LeoneSingaporeSomaliaSouth AfricaSouth AmericaSouth Central AsiaSouth Eastern AsiaSouthern EuropeSpainSri LankaSt. Vincent and the GrenadinesSudanSwedenSwitzerlandSyriaTaiwanThailandTrinidad and TobagoTurkeyUgandaUkraineUruguayUzbekistanVenezuelaVietnamWest IndiesWestern AfricaWestern AsiaWestern EuropeYemenZaireZimbabweAzores
9th Grade
Income
Poverty
Unemployment
Labor Participation
Family Structure
Vehicle Availability
Education Level
Disability

9th Grade Comparison

Immigrants from Guyana

French

Tragic
Exceptional
92.5%
9TH GRADE
0.0/ 100
METRIC RATING
308th/ 347
METRIC RANK
96.3%
9TH GRADE
100.0/ 100
METRIC RATING
25th/ 347
METRIC RANK

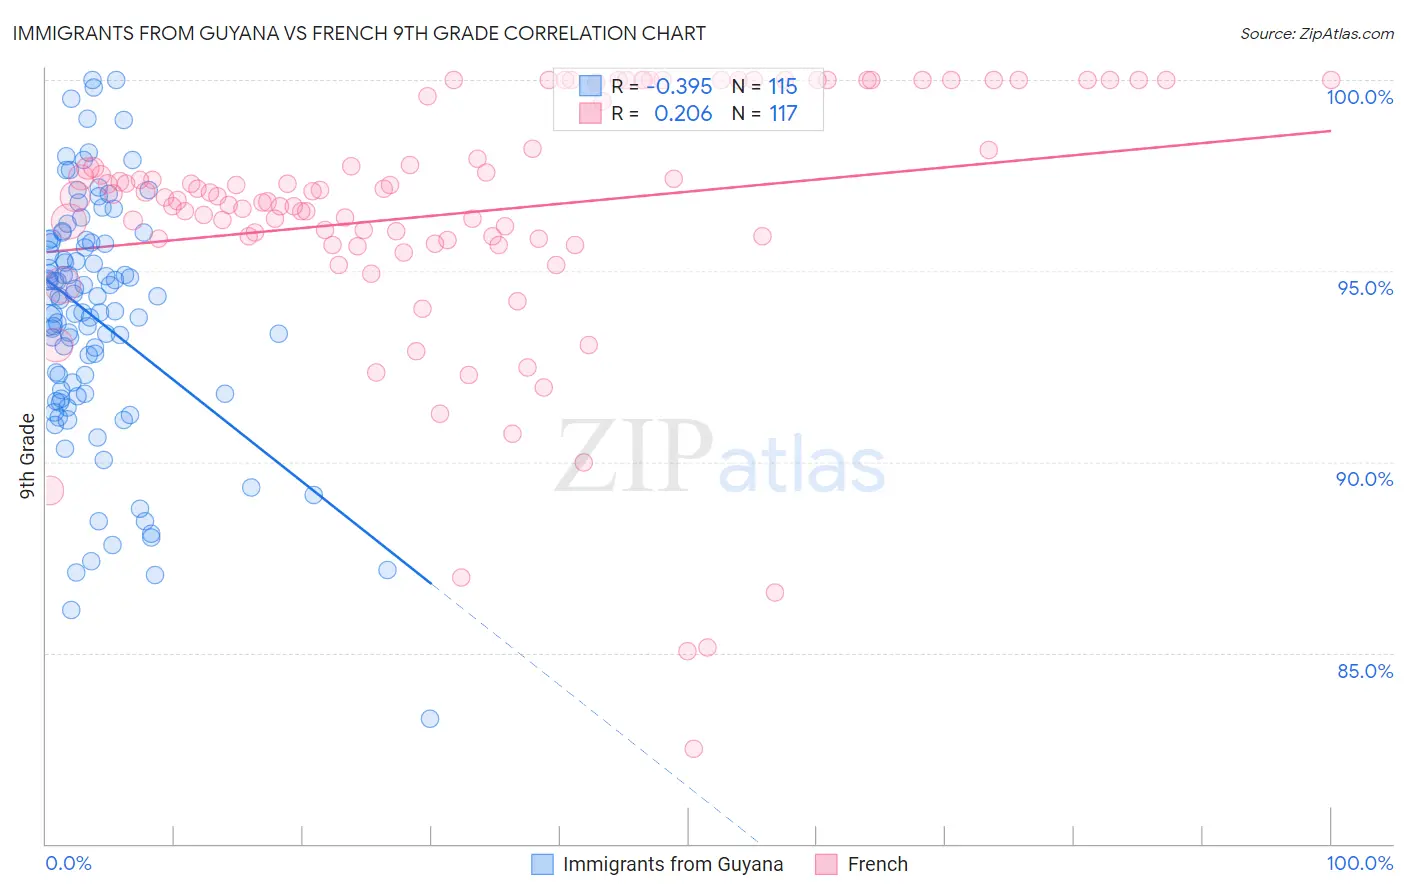
Immigrants from Guyana vs French 9th Grade Correlation Chart

The statistical analysis conducted on geographies consisting of 183,673,461 people shows a mild negative correlation between the proportion of Immigrants from Guyana and percentage of population with at least 9th grade education in the United States with a correlation coefficient (R) of -0.395 and weighted average of 92.5%. Similarly, the statistical analysis conducted on geographies consisting of 572,427,255 people shows a weak positive correlation between the proportion of French and percentage of population with at least 9th grade education in the United States with a correlation coefficient (R) of 0.206 and weighted average of 96.3%, a difference of 4.1%.
Immigrants from Guyana vs French 9th Grade

9th Grade Correlation Summary

MeasurementImmigrants from GuyanaFrench
Minimum83.3%82.5%
Maximum100.0%100.0%
Range16.7%17.5%
Mean93.7%96.5%
Median94.3%96.9%
Interquartile 25% (IQ1)91.8%95.8%
Interquartile 75% (IQ3)95.7%99.5%
Interquartile Range (IQR)4.0%3.7%
Standard Deviation (Sample)3.2%3.4%
Standard Deviation (Population)3.2%3.4%

Similar Demographics by 9th Grade

Demographics Similar to Immigrants from Guyana by 9th Grade

In terms of 9th grade, the demographic groups most similar to Immigrants from Guyana are Immigrants (92.5%, a difference of 0.010%), Japanese (92.6%, a difference of 0.11%), Immigrants from Vietnam (92.6%, a difference of 0.11%), Tohono O'odham (92.6%, a difference of 0.13%), and Guyanese (92.7%, a difference of 0.15%).
DemographicsRating | Rank9th Grade
Immigrants | Haiti
0.0
/100
|
#301
Tragic
92.7%
Immigrants | Dominica
0.0
/100
|
#302
Tragic
92.7%
Guyanese
0.0
/100
|
#303
Tragic
92.7%
Tohono O'odham
0.0
/100
|
#304
Tragic
92.6%
Japanese
0.0
/100
|
#305
Tragic
92.6%
Immigrants | Vietnam
0.0
/100
|
#306
Tragic
92.6%
Immigrants | Immigrants
0.0
/100
|
#307
Tragic
92.5%
Immigrants | Guyana
0.0
/100
|
#308
Tragic
92.5%
Immigrants | Bangladesh
0.0
/100
|
#309
Tragic
92.4%
Immigrants | Cambodia
0.0
/100
|
#310
Tragic
92.4%
Immigrants | Fiji
0.0
/100
|
#311
Tragic
92.3%
Houma
0.0
/100
|
#312
Tragic
92.3%
Vietnamese
0.0
/100
|
#313
Tragic
92.3%
Immigrants | Portugal
0.0
/100
|
#314
Tragic
92.2%
Immigrants | Caribbean
0.0
/100
|
#315
Tragic
92.2%

Demographics Similar to French by 9th Grade

In terms of 9th grade, the demographic groups most similar to French are Latvian (96.4%, a difference of 0.010%), French Canadian (96.3%, a difference of 0.030%), Czech (96.4%, a difference of 0.040%), Scotch-Irish (96.3%, a difference of 0.040%), and Eastern European (96.3%, a difference of 0.040%).
DemographicsRating | Rank9th Grade
Scandinavians
100.0
/100
|
#18
Exceptional
96.5%
Welsh
100.0
/100
|
#19
Exceptional
96.4%
Italians
100.0
/100
|
#20
Exceptional
96.4%
Alaskan Athabascans
100.0
/100
|
#21
Exceptional
96.4%
Europeans
100.0
/100
|
#22
Exceptional
96.4%
Czechs
100.0
/100
|
#23
Exceptional
96.4%
Latvians
100.0
/100
|
#24
Exceptional
96.4%
French
100.0
/100
|
#25
Exceptional
96.3%
French Canadians
100.0
/100
|
#26
Exceptional
96.3%
Scotch-Irish
100.0
/100
|
#27
Exceptional
96.3%
Eastern Europeans
100.0
/100
|
#28
Exceptional
96.3%
Chinese
100.0
/100
|
#29
Exceptional
96.3%
Maltese
100.0
/100
|
#30
Exceptional
96.3%
British
100.0
/100
|
#31
Exceptional
96.3%
Belgians
100.0
/100
|
#32
Exceptional
96.3%