Immigrants from Guatemala vs European No Schooling Completed
COMPARE
Immigrants from Guatemala
European
No Schooling Completed
No Schooling Completed Comparison
Immigrants from Guatemala
Europeans
3.6%
NO SCHOOLING COMPLETED
0.0/ 100
METRIC RATING
340th/ 347
METRIC RANK
1.5%
NO SCHOOLING COMPLETED
100.0/ 100
METRIC RATING
23rd/ 347
METRIC RANK
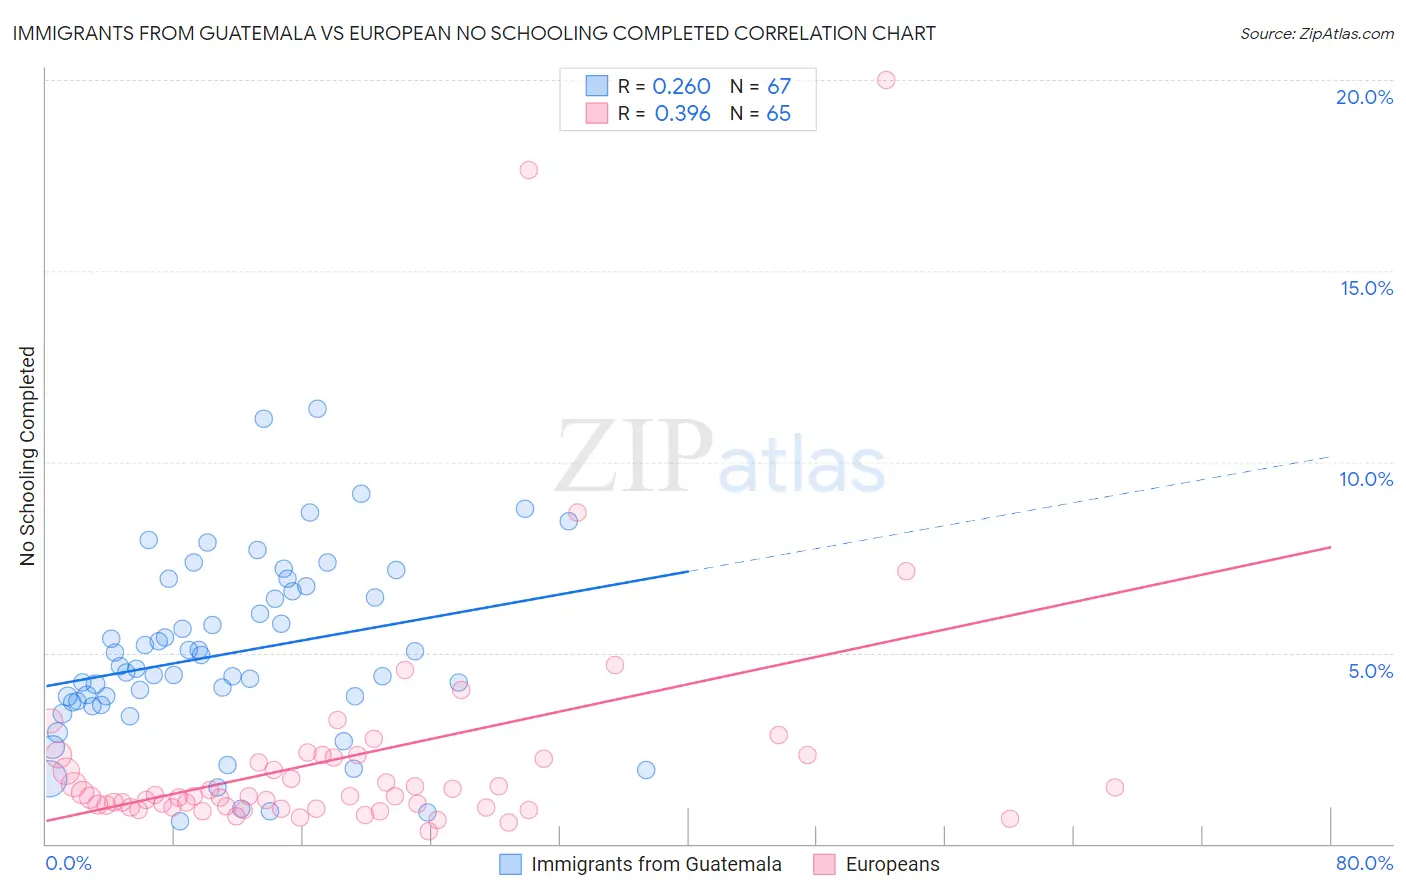
Immigrants from Guatemala vs European No Schooling Completed Correlation Chart
The statistical analysis conducted on geographies consisting of 375,195,495 people shows a weak positive correlation between the proportion of Immigrants from Guatemala and percentage of population with no schooling in the United States with a correlation coefficient (R) of 0.260 and weighted average of 3.6%. Similarly, the statistical analysis conducted on geographies consisting of 544,915,278 people shows a mild positive correlation between the proportion of Europeans and percentage of population with no schooling in the United States with a correlation coefficient (R) of 0.396 and weighted average of 1.5%, a difference of 142.0%.
No Schooling Completed Correlation Summary
| Measurement | Immigrants from Guatemala | European |
| Minimum | 0.58% | 0.31% |
| Maximum | 11.4% | 20.0% |
| Range | 10.8% | 19.7% |
| Mean | 5.0% | 2.3% |
| Median | 4.6% | 1.2% |
| Interquartile 25% (IQ1) | 3.7% | 0.96% |
| Interquartile 75% (IQ3) | 6.6% | 2.3% |
| Interquartile Range (IQR) | 2.9% | 1.3% |
| Standard Deviation (Sample) | 2.3% | 3.3% |
| Standard Deviation (Population) | 2.3% | 3.3% |
Similar Demographics by No Schooling Completed
Demographics Similar to Immigrants from Guatemala by No Schooling Completed
In terms of no schooling completed, the demographic groups most similar to Immigrants from Guatemala are Yakama (3.6%, a difference of 0.68%), Bangladeshi (3.5%, a difference of 1.0%), Immigrants from Central America (3.6%, a difference of 1.1%), Immigrants from Cabo Verde (3.5%, a difference of 1.2%), and Immigrants from Mexico (3.6%, a difference of 1.9%).
| Demographics | Rating | Rank | No Schooling Completed |
| Immigrants | Dominican Republic | 0.0 /100 | #333 | Tragic 3.4% |
| Guatemalans | 0.0 /100 | #334 | Tragic 3.5% |
| Immigrants | Cambodia | 0.0 /100 | #335 | Tragic 3.5% |
| Immigrants | Fiji | 0.0 /100 | #336 | Tragic 3.5% |
| Immigrants | Cabo Verde | 0.0 /100 | #337 | Tragic 3.5% |
| Bangladeshis | 0.0 /100 | #338 | Tragic 3.5% |
| Yakama | 0.0 /100 | #339 | Tragic 3.6% |
| Immigrants | Guatemala | 0.0 /100 | #340 | Tragic 3.6% |
| Immigrants | Central America | 0.0 /100 | #341 | Tragic 3.6% |
| Immigrants | Mexico | 0.0 /100 | #342 | Tragic 3.6% |
| Salvadorans | 0.0 /100 | #343 | Tragic 3.7% |
| Nepalese | 0.0 /100 | #344 | Tragic 3.8% |
| Immigrants | El Salvador | 0.0 /100 | #345 | Tragic 3.9% |
| Immigrants | Yemen | 0.0 /100 | #346 | Tragic 4.1% |
| Spanish American Indians | 0.0 /100 | #347 | Tragic 4.2% |
Demographics Similar to Europeans by No Schooling Completed
In terms of no schooling completed, the demographic groups most similar to Europeans are Alaska Native (1.5%, a difference of 0.25%), Chinese (1.5%, a difference of 0.34%), Pennsylvania German (1.5%, a difference of 0.35%), French (1.5%, a difference of 0.37%), and Welsh (1.5%, a difference of 0.71%).
| Demographics | Rating | Rank | No Schooling Completed |
| Finns | 100.0 /100 | #16 | Exceptional 1.5% |
| Croatians | 100.0 /100 | #17 | Exceptional 1.5% |
| Danes | 100.0 /100 | #18 | Exceptional 1.5% |
| Alaskan Athabascans | 100.0 /100 | #19 | Exceptional 1.5% |
| Welsh | 100.0 /100 | #20 | Exceptional 1.5% |
| Chinese | 100.0 /100 | #21 | Exceptional 1.5% |
| Alaska Natives | 100.0 /100 | #22 | Exceptional 1.5% |
| Europeans | 100.0 /100 | #23 | Exceptional 1.5% |
| Pennsylvania Germans | 100.0 /100 | #24 | Exceptional 1.5% |
| French | 100.0 /100 | #25 | Exceptional 1.5% |
| Czechs | 100.0 /100 | #26 | Exceptional 1.5% |
| Scandinavians | 100.0 /100 | #27 | Exceptional 1.5% |
| French Canadians | 100.0 /100 | #28 | Exceptional 1.5% |
| Lumbee | 100.0 /100 | #29 | Exceptional 1.5% |
| British | 100.0 /100 | #30 | Exceptional 1.5% |