Immigrants from Grenada vs Subsaharan African Master's Degree

COMPARE

Immigrants from Grenada
Race
Ancestry
AfghanAfricanAlaska NativeAlaskan AthabascanAlbanianAleutAlsatianAmericanApacheArabArapahoArgentineanArmenianAssyrian/Chaldean/SyriacAustralianAustrianBahamianBangladeshiBarbadianBasqueBelgianBelizeanBermudanBhutaneseBlackfeetBolivianBrazilianBritishBritish West IndianBulgarianBurmeseCajunCambodianCanadianCape VerdeanCarpatho RusynCelticCentral AmericanCentral American IndianCherokeeCheyenneChickasawChileanChineseChippewaChoctawColombianColvilleComancheCosta RicanCreeCreekCroatianCrowCubanCypriotCzechCzechoslovakianDanishDelawareDominicanDutchDutch West IndianEastern EuropeanEcuadorianEgyptianEnglishEstonianEthiopianEuropeanFijianFilipinoFinnishFrenchFrench American IndianFrench CanadianGermanGerman RussianGhanaianGreekGuamanian/ChamorroGuatemalanGuyaneseHaitianHmongHonduranHopiHoumaHungarianIcelanderIndian (Asian)IndonesianInupiatIranianIraqiIrishIroquoisIsraeliItalianJamaicanJapaneseJordanianKenyanKiowaKoreanLaotianLatvianLebaneseLiberianLithuanianLumbeeLuxembourgerMacedonianMalaysianMalteseMarshalleseMenomineeMexicanMexican American IndianMongolianMoroccanNative HawaiianNavajoNepaleseNew ZealanderNicaraguanNigerianNorthern EuropeanNorwegianOkinawanOsageOttawaPaiutePakistaniPalestinianPanamanianParaguayanPennsylvania GermanPeruvianPimaPolishPortuguesePotawatomiPuebloPuerto RicanPuget Sound SalishRomanianRussianSalvadoranSamoanScandinavianScotch-IrishScottishSeminoleSenegaleseSerbianShoshoneSierra LeoneanSiouxSlavicSlovakSloveneSomaliSouth AfricanSouth AmericanSouth American IndianSoviet UnionSpaniardSpanishSpanish AmericanSpanish American IndianSri LankanSudaneseSwedishSwissSyrianTaiwaneseThaiTlingit-HaidaTohono O'OdhamTonganTrinidadian and TobagonianTsimshianTurkishU.S. Virgin IslanderUgandanUkrainianUruguayanUteVenezuelanVietnameseWelshWest IndianYakamaYaquiYugoslavianYumanYup'ikZimbabwean
Immigration
NonimmigrantsImmigrantsAfghanistanAfricaAlbaniaArgentinaArmeniaAsiaAustraliaAustriaBahamasBangladeshBarbadosBelarusBelgiumBelizeBoliviaBosnia and HerzegovinaBrazilBulgariaBurma/MyanmarCabo VerdeCambodiaCameroonCanadaCaribbeanCentral AmericaChileChinaColombiaCongoCosta RicaCroatiaCubaCzechoslovakiaDenmarkDominicaDominican RepublicEastern AfricaEastern AsiaEastern EuropeEcuadorEgyptEl SalvadorEnglandEritreaEthiopiaEuropeFijiFranceGermanyGhanaGreeceGrenadaGuatemalaGuyanaHaitiHondurasHong KongHungaryIndiaIndonesiaIranIraqIrelandIsraelItalyJamaicaJapanJordanKazakhstanKenyaKoreaKuwaitLaosLatin AmericaLatviaLebanonLiberiaLithuaniaMalaysiaMexicoMicronesiaMiddle AfricaMoldovaMoroccoNepalNetherlandsNicaraguaNigeriaNorth AmericaNorth MacedoniaNorthern AfricaNorthern EuropeNorwayOceaniaPakistanPanamaPeruPhilippinesPolandPortugalRomaniaRussiaSaudi ArabiaScotlandSenegalSerbiaSierra LeoneSingaporeSomaliaSouth AfricaSouth AmericaSouth Central AsiaSouth Eastern AsiaSouthern EuropeSpainSri LankaSt. Vincent and the GrenadinesSudanSwedenSwitzerlandSyriaTaiwanThailandTrinidad and TobagoTurkeyUgandaUkraineUruguayUzbekistanVenezuelaVietnamWest IndiesWestern AfricaWestern AsiaWestern EuropeYemenZaireZimbabweAzores
Subsaharan African
Race
Ancestry
AfghanAfricanAlaska NativeAlaskan AthabascanAlbanianAleutAlsatianAmericanApacheArabArapahoArgentineanArmenianAssyrian/Chaldean/SyriacAustralianAustrianBahamianBangladeshiBarbadianBasqueBelgianBelizeanBermudanBhutaneseBlackfeetBolivianBrazilianBritishBritish West IndianBulgarianBurmeseCajunCambodianCanadianCape VerdeanCarpatho RusynCelticCentral AmericanCentral American IndianCherokeeCheyenneChickasawChileanChineseChippewaChoctawColombianColvilleComancheCosta RicanCreeCreekCroatianCrowCubanCypriotCzechCzechoslovakianDanishDelawareDominicanDutchDutch West IndianEastern EuropeanEcuadorianEgyptianEnglishEstonianEthiopianEuropeanFijianFilipinoFinnishFrenchFrench American IndianFrench CanadianGermanGerman RussianGhanaianGreekGuamanian/ChamorroGuatemalanGuyaneseHaitianHmongHonduranHopiHoumaHungarianIcelanderIndian (Asian)IndonesianInupiatIranianIraqiIrishIroquoisIsraeliItalianJamaicanJapaneseJordanianKenyanKiowaKoreanLaotianLatvianLebaneseLiberianLithuanianLumbeeLuxembourgerMacedonianMalaysianMalteseMarshalleseMenomineeMexicanMexican American IndianMongolianMoroccanNative HawaiianNavajoNepaleseNew ZealanderNicaraguanNigerianNorthern EuropeanNorwegianOkinawanOsageOttawaPaiutePakistaniPalestinianPanamanianParaguayanPennsylvania GermanPeruvianPimaPolishPortuguesePotawatomiPuebloPuerto RicanPuget Sound SalishRomanianRussianSalvadoranSamoanScandinavianScotch-IrishScottishSeminoleSenegaleseSerbianShoshoneSierra LeoneanSiouxSlavicSlovakSloveneSomaliSouth AfricanSouth AmericanSouth American IndianSoviet UnionSpaniardSpanishSpanish AmericanSpanish American IndianSri LankanSubsaharan AfricanSudaneseSwedishSwissSyrianTaiwaneseThaiTlingit-HaidaTohono O'OdhamTonganTrinidadian and TobagonianTsimshianTurkishU.S. Virgin IslanderUgandanUkrainianUruguayanUteVenezuelanVietnameseWelshWest IndianYakamaYaquiYugoslavianYumanYup'ikZimbabwean
Immigration
NonimmigrantsImmigrantsAfghanistanAfricaAlbaniaArgentinaArmeniaAsiaAustraliaAustriaBahamasBangladeshBarbadosBelarusBelgiumBelizeBoliviaBosnia and HerzegovinaBrazilBulgariaBurma/MyanmarCabo VerdeCambodiaCameroonCanadaCaribbeanCentral AmericaChileChinaColombiaCongoCosta RicaCroatiaCubaCzechoslovakiaDenmarkDominicaDominican RepublicEastern AfricaEastern AsiaEastern EuropeEcuadorEgyptEl SalvadorEnglandEritreaEthiopiaEuropeFijiFranceGermanyGhanaGreeceGuatemalaGuyanaHaitiHondurasHong KongHungaryIndiaIndonesiaIranIraqIrelandIsraelItalyJamaicaJapanJordanKazakhstanKenyaKoreaKuwaitLaosLatin AmericaLatviaLebanonLiberiaLithuaniaMalaysiaMexicoMicronesiaMiddle AfricaMoldovaMoroccoNepalNetherlandsNicaraguaNigeriaNorth AmericaNorth MacedoniaNorthern AfricaNorthern EuropeNorwayOceaniaPakistanPanamaPeruPhilippinesPolandPortugalRomaniaRussiaSaudi ArabiaScotlandSenegalSerbiaSierra LeoneSingaporeSomaliaSouth AfricaSouth AmericaSouth Central AsiaSouth Eastern AsiaSouthern EuropeSpainSri LankaSt. Vincent and the GrenadinesSudanSwedenSwitzerlandSyriaTaiwanThailandTrinidad and TobagoTurkeyUgandaUkraineUruguayUzbekistanVenezuelaVietnamWest IndiesWestern AfricaWestern AsiaWestern EuropeYemenZaireZimbabweAzores
Master's Degree
Income
Poverty
Unemployment
Labor Participation
Family Structure
Vehicle Availability
Education Level
Disability

Master's Degree Comparison

Immigrants from Grenada

Sub-Saharan Africans

Poor
Poor
14.0%
MASTER'S DEGREE
11.8/ 100
METRIC RATING
224th/ 347
METRIC RANK
14.2%
MASTER'S DEGREE
19.4/ 100
METRIC RATING
210th/ 347
METRIC RANK

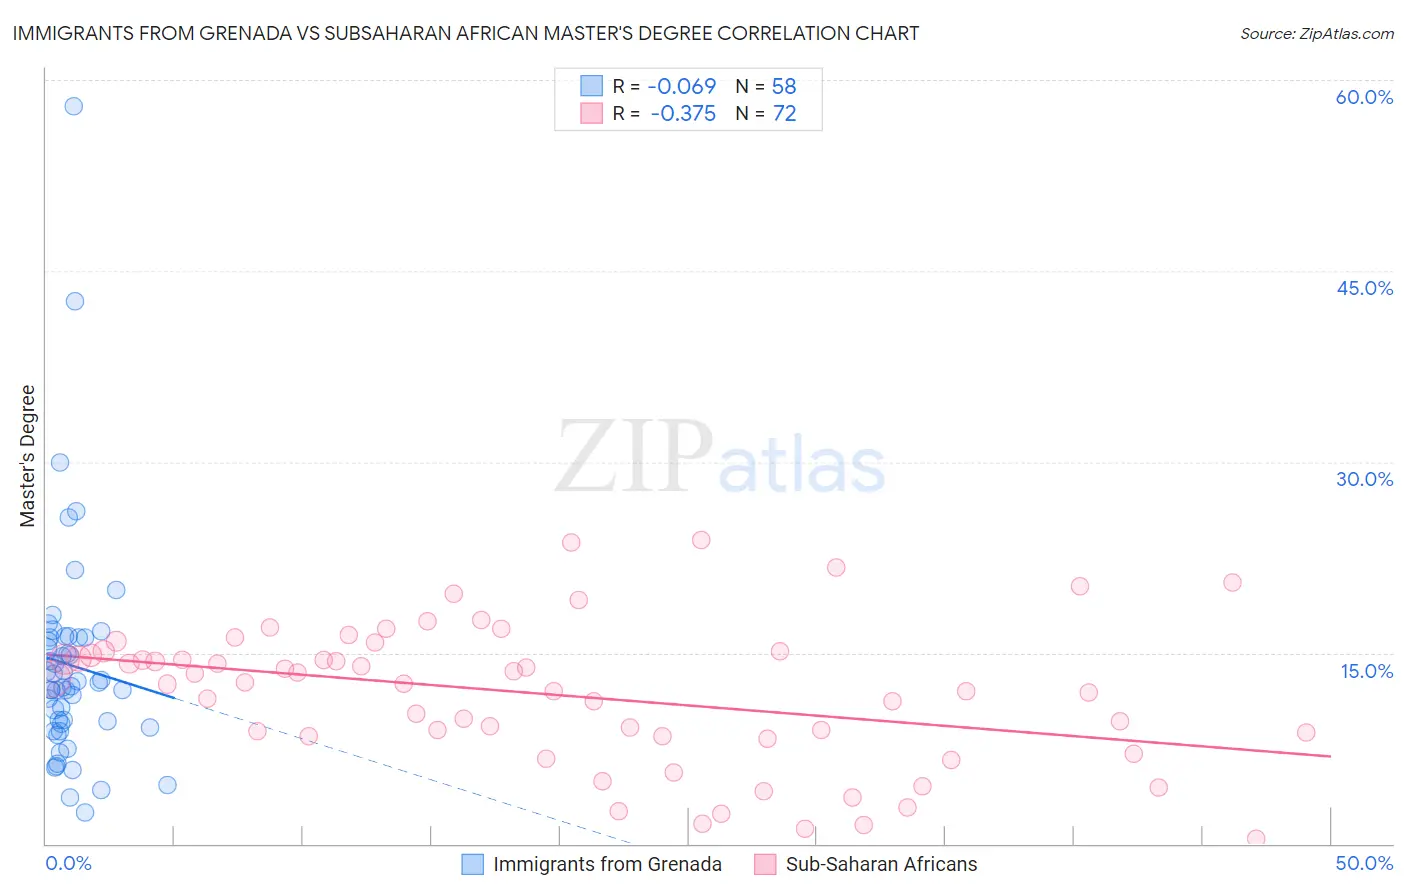
Immigrants from Grenada vs Subsaharan African Master's Degree Correlation Chart

The statistical analysis conducted on geographies consisting of 67,201,096 people shows a slight negative correlation between the proportion of Immigrants from Grenada and percentage of population with at least master's degree education in the United States with a correlation coefficient (R) of -0.069 and weighted average of 14.0%. Similarly, the statistical analysis conducted on geographies consisting of 507,799,388 people shows a mild negative correlation between the proportion of Sub-Saharan Africans and percentage of population with at least master's degree education in the United States with a correlation coefficient (R) of -0.375 and weighted average of 14.2%, a difference of 2.0%.
Immigrants from Grenada vs Subsaharan African Master's Degree

Master's Degree Correlation Summary

MeasurementImmigrants from GrenadaSubsaharan African
Minimum2.4%0.40%
Maximum57.9%23.9%
Range55.5%23.5%
Mean14.0%11.7%
Median12.5%12.6%
Interquartile 25% (IQ1)9.5%8.5%
Interquartile 75% (IQ3)16.2%15.0%
Interquartile Range (IQR)6.7%6.5%
Standard Deviation (Sample)8.9%5.5%
Standard Deviation (Population)8.8%5.5%

Demographics Similar to Immigrants from Grenada and Sub-Saharan Africans by Master's Degree

In terms of master's degree, the demographic groups most similar to Immigrants from Grenada are Immigrants from South Eastern Asia (14.0%, a difference of 0.050%), Portuguese (13.9%, a difference of 0.21%), Ecuadorian (14.0%, a difference of 0.25%), Immigrants from St. Vincent and the Grenadines (13.9%, a difference of 0.26%), and Korean (14.0%, a difference of 0.28%). Similarly, the demographic groups most similar to Sub-Saharan Africans are Immigrants from Panama (14.3%, a difference of 0.13%), Immigrants from Barbados (14.3%, a difference of 0.22%), Somali (14.2%, a difference of 0.31%), Spanish (14.2%, a difference of 0.36%), and Immigrants from Bosnia and Herzegovina (14.3%, a difference of 0.52%).
DemographicsRating | RankMaster's Degree
Immigrants | Bosnia and Herzegovina
22.0
/100
|
#207
Fair
14.3%
Immigrants | Barbados
20.5
/100
|
#208
Fair
14.3%
Immigrants | Panama
20.0
/100
|
#209
Fair
14.3%
Sub-Saharan Africans
19.4
/100
|
#210
Poor
14.2%
Somalis
18.0
/100
|
#211
Poor
14.2%
Spanish
17.8
/100
|
#212
Poor
14.2%
Immigrants | Thailand
17.0
/100
|
#213
Poor
14.2%
Finns
16.9
/100
|
#214
Poor
14.2%
Immigrants | Vietnam
16.1
/100
|
#215
Poor
14.1%
Immigrants | Somalia
15.8
/100
|
#216
Poor
14.1%
Immigrants | Trinidad and Tobago
15.8
/100
|
#217
Poor
14.1%
French Canadians
14.9
/100
|
#218
Poor
14.1%
Norwegians
13.6
/100
|
#219
Poor
14.0%
Germans
13.1
/100
|
#220
Poor
14.0%
Koreans
12.7
/100
|
#221
Poor
14.0%
Ecuadorians
12.6
/100
|
#222
Poor
14.0%
Immigrants | South Eastern Asia
11.9
/100
|
#223
Poor
14.0%
Immigrants | Grenada
11.8
/100
|
#224
Poor
14.0%
Portuguese
11.2
/100
|
#225
Poor
13.9%
Immigrants | St. Vincent and the Grenadines
11.0
/100
|
#226
Poor
13.9%
Immigrants | West Indies
9.8
/100
|
#227
Tragic
13.9%